Charts
Candlestick chart
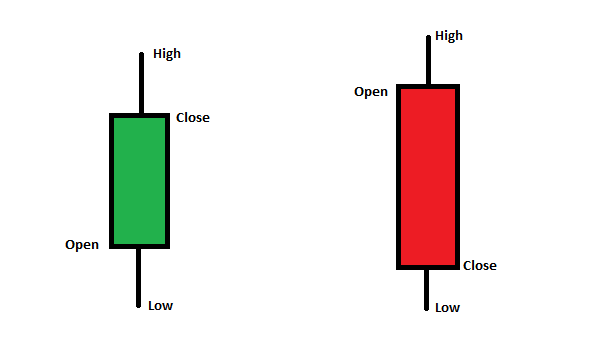
Japanese candlesticks have the potential of giving confirmation to signals generated by traditional (Western) technical analysis techniques. Candlesticks are a complete approach to chart analysis that is sufficiently independent of Western techniques that value is added when they are combined. Moreover, since candlestick charts are created using the same information as Western bar charts (i.e., open, high, low, close), they can be smoothly related one to the other.
Heikin-Ashi chart
Heikin-Ashi Candlesticks are an offshoot from Japanese candlesticks. Heikin-Ashi Candlesticks use the open-close data from the prior period and the open-high-low-close data from the current period to create a combo candlestick. The resulting candlestick filters out some noise in an effort to better capture the trend. In Japanese, Heikin means “average” and ashi means “pace”. Taken together, Heikin-Ashi represents the average pace of prices. Heikin-Ashi Candlesticks are not used like normal candlesticks. Dozens of bullish or bearish reversal patterns consisting of 1-3 candlesticks are not to be found. Instead, these candlesticks can be used to identify trending periods, potential reversal points and classic technical analysis patterns.
Calculations
-
The Heikin-Ashi Close is simply an average of the open, high, low and close for the current period.
HA-Close = (Open(0) + High(0) + Low(0) + Close(0)) / 4 -
The Heikin-Ashi Open is the average of the prior Heikin-Ashi candlestick open plus the close of the prior Heikin-Ashi candlestick.
HA-Open = (HA-Open(-1) + HA-Close(-1)) / 2 -
The Heikin-Ashi High is the maximum of three data points: the current period's high, the current Heikin-Ashi candlestick open or the current Heikin-Ashi candlestick close.
HA-High = Maximum of the High(0), HA-Open(0) or HA-Close(0) -
The Heikin-Ashi low is the minimum of three data points: the current period's low, the current Heikin-Ashi candlestick open or the current Heikin-Ashi candlestick close.
HA-Low = Minimum of the Low(0), HA-Open(0) or HA-Close(0)
Heikin-Ashi Candlesticks are similar to but different than normal candlesticks. While traditional candlestick patterns do not exist with Heikin-Ashi Candlesticks, chartists can derive valuable information from these charts. A long hollow Heikin-Ashi candlestick shows strong buying pressure over a two day period. The absence of a lower shadow also reflects strength. A long filled Heikin-Ashi candlestick shows strong selling pressure over a two day period. The absence of an upper shadow also reflects selling pressure. Small Heikin-Ashi candlesticks or those with long upper and lower shadows show indecision over the last two days. This often occurs when the two normal candlesticks are of opposite color.
Renko chart
Renko charts are created by setting a box size/brick size. A brick on the renko chart is formed only when the price has moved up/down by the set brick size. A candlestick chart, on the other hand, shows the price movement over a period of time, such as one minute or one day. While there is a time axis along with the renko chart, there is no set time limit for how long a renko brick takes to form. It could take 2.5 minutes, 8 minutes or 8 days. It is dependent on the volatility of the asset and the set brick size.
Note
Currently Renko is available only in the Basic Create page.
Important
ChartIQ charts perform a time shift to by 1, to the right, which means if the renko bar is formed for 11:55 Am it will have the time of previous candle in ChartIQ, where as other charts like Investing or TradingView show the same renko pattern without time shift.
While doing backtest don't perform any time shift, so as to keep the backtest triggers times and price as realistic and close to deployment as possible, an example of this is shown in the image below.
Note
During backtesting, the trade price is the close price of the candle which generate the signal (unlike other charts where the trade price is the open price of the next candle) as the next renko bar can form after many underlying candlesticks.
You have to choose the desired brick size while selecting Renko chart, making sure to select a brick size which meets the following criteria to get more practical results:
- The brick size should be big enough to smoothly represent the stock movement for that candle interval in the charts.
- The brick size should also be such that on average there are no more than 1 brick being formed for the chosen candle interval.
Examples to set brick sizes:
- Brick size can be set as the difference between pivot point line and support 1 line of the desired candle interval.
- Brick size can be set the ATR value of the desired candle interval.
With experience and usage one can directly set the renko size by seeing the movements of the stock or based on their desired target profits and stop loss. During backtest and deployment, we calculate renko bricks only at the completion of each candle interval and perform trades when the condition has been met only for the last renko brick formed for that specific candle interval.
The reasoning behind this is following:
- This forms a consistent approach between backtest and deployment
- Immune to repainting of renko and hence makes it verifiable in hindsight
- This also avoids trading in between the candle interval where the actual stock price is available during backtesting. As renko bricks are formed after the price movement, this helps us prevent any practical inconsistency that might come during deployment.
We don’t account for the latest partially formed renko bricks as these bricks keep changing in both color and size based on price movement and can sometimes completely disappear as well. We only account and process completely formed renko bricks, which helps maintain consistency between backtested results and deployment notifications.
With renko, few indicators are not perfectly compatible, and they fall in the following category:
- Indicators using volume like : VWAP, OBV, VOLUME, MOVING AVERAGE OF VOLUME. As volume calculation for Renko is zero
- Aggregation based indicators like : Opening range, prev N as renko candles are not uniformly spaced in time Eg: For opening range first 15min high may not get established if no Renko brick itself is formed
When backtesting with MIS and Renko chart type, some MIS square-offs can get missed if there is no Renko brick formed at 3:15pm. During backtesting, in the transaction table the trade price is the close price of the candlestick chart which generated the signal to which the renko brick has completely closed. This has been designed as such to avoid any overlap in the time and demonstrate absolute practicality. During verification of Renko, the Renko notification signal time and in backtest transaction table might vary when looking back at chart due to repainting of chart and residual carryover while painting of renko from different start time, but the Renko pattern and values remain the same and will always match.