Creating Conditions
Creating a strategy
Streak has a simple intuitive interface that lets you create your own customised strategies. Strategies are made by keying in Entry conditions (made up of technical indicators), Exit conditions (made up of stop loss, target profit percentage, and an optional exit condition based on technical indicators), and additional parameters such as chart type, holding type etc.
The Streak platform supports over 80+ technical indicators including Supertrend, MACD, RSI, Momentum indicator, Moving Average.
Below is a step by step breakdown of the "Creating a Strategy":
Step 1: Positions
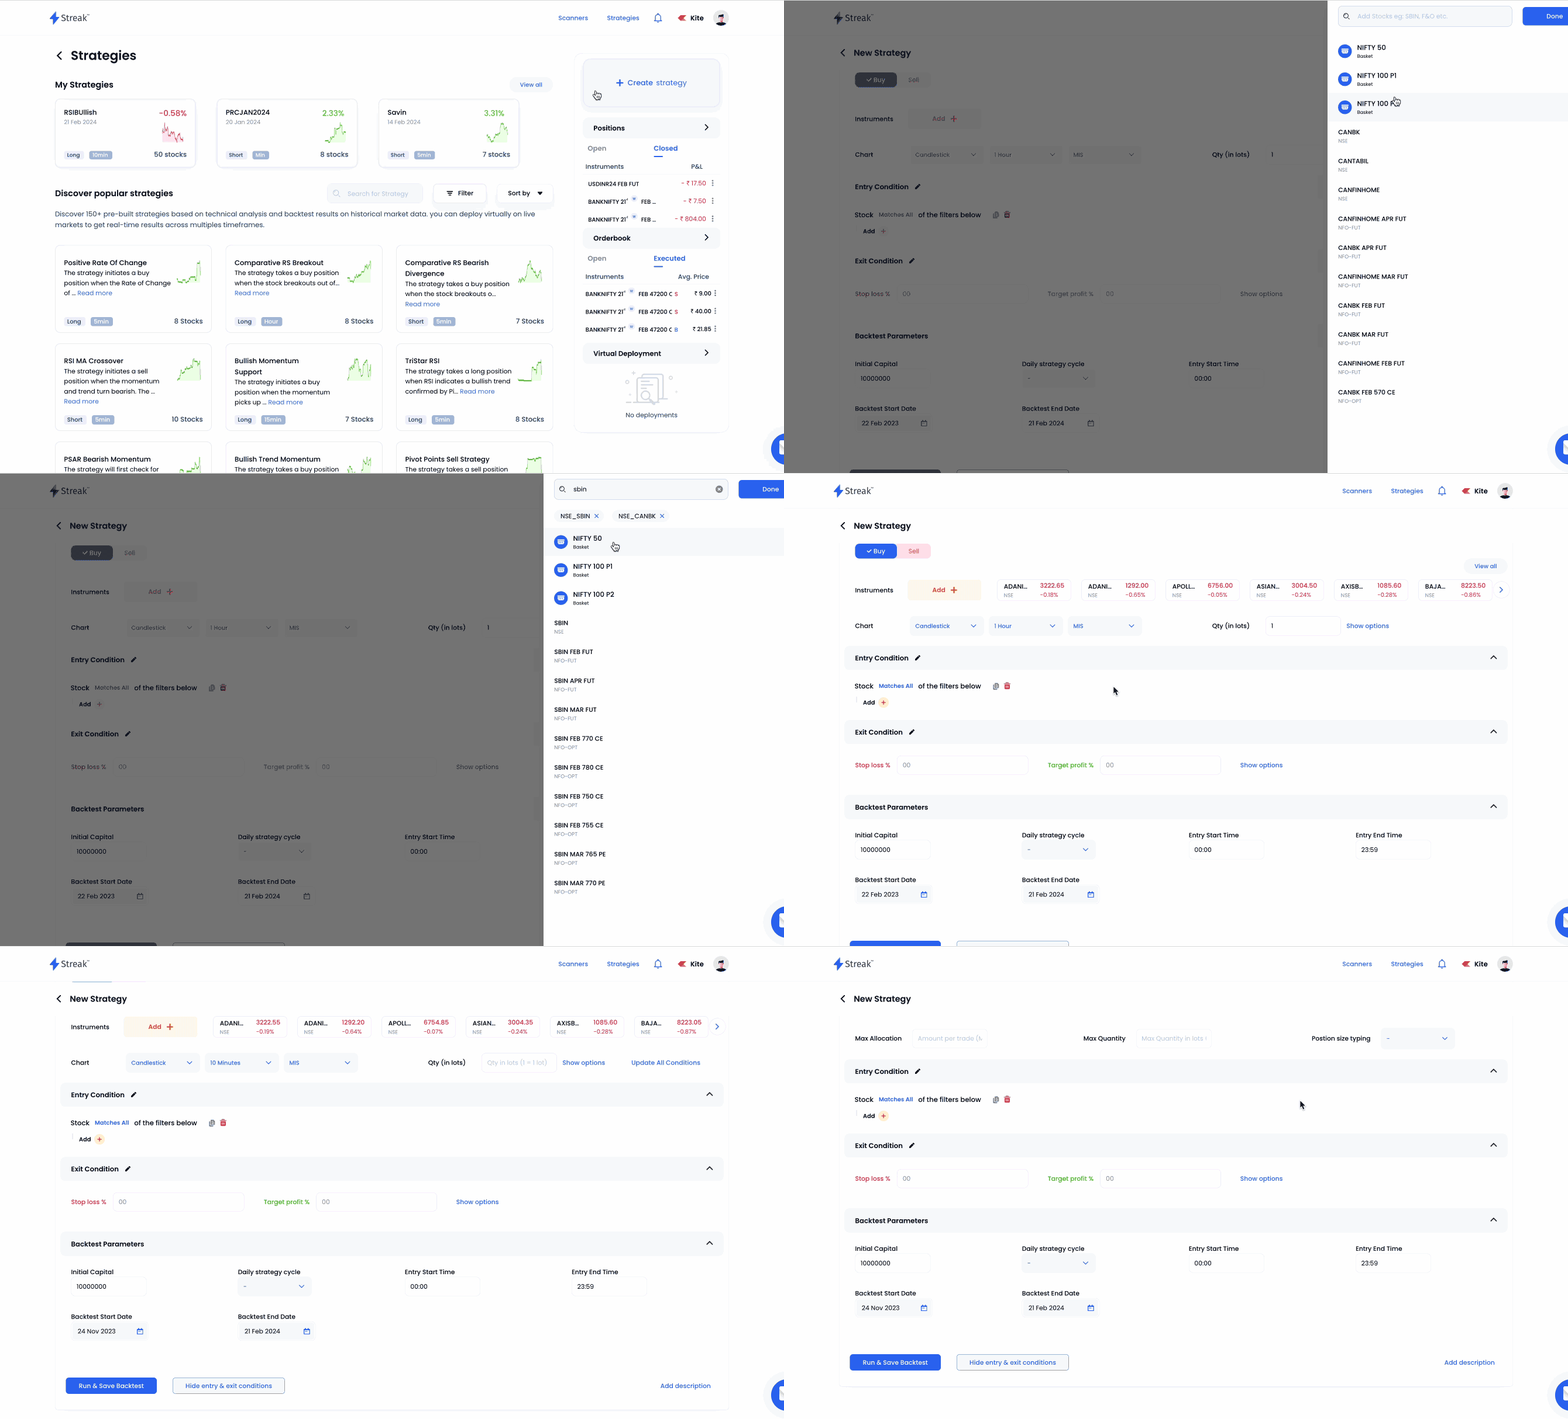
In this section, you can choose your Entry type (either Buy or Sell), instruments you want to trade with and charting parameters.
-
Scrip/Instrument You can select the stock, commodity, or currency futures from NSE. You can add upto a maximum of 50 instruments in a single strategy.
-
Chart You can select the chart type as Candlestick or Heikin-Ashi.
You can also choose the candle interval
- 1 minute checks for signals on minute candles with a maximum allowed window of 30 days
- 3 minute to 30 minutes checks for signals on the respective candles based on data availability with a maximum allowed window of 90 days.
- 1 hour candle checks for signals on an hourly candle with a maximum allowed window of 1 year based on data availability.
- 1 day candle checks for signals on a day candle with a maximum allowed window of 5 years based on data availability.You can change order type from MIS(Intraday) to CNC/NRML(Delivery).
-
Quantity is the number of equity share or future lots to be used by the strategy.
Example
Scrip: SBIN, SBIN25FEBFUT Timeframe: 15 min
Position: Buy Quantity: 1
In the above example, the platform will consider the quantity for SBIN as 1 and quantity for SBIN25FEBFUT as 1 lot, i.e. 750 stocks.
- Advance Options Click here to read more about Quantity types and PositionSizing
Step 2: Entry
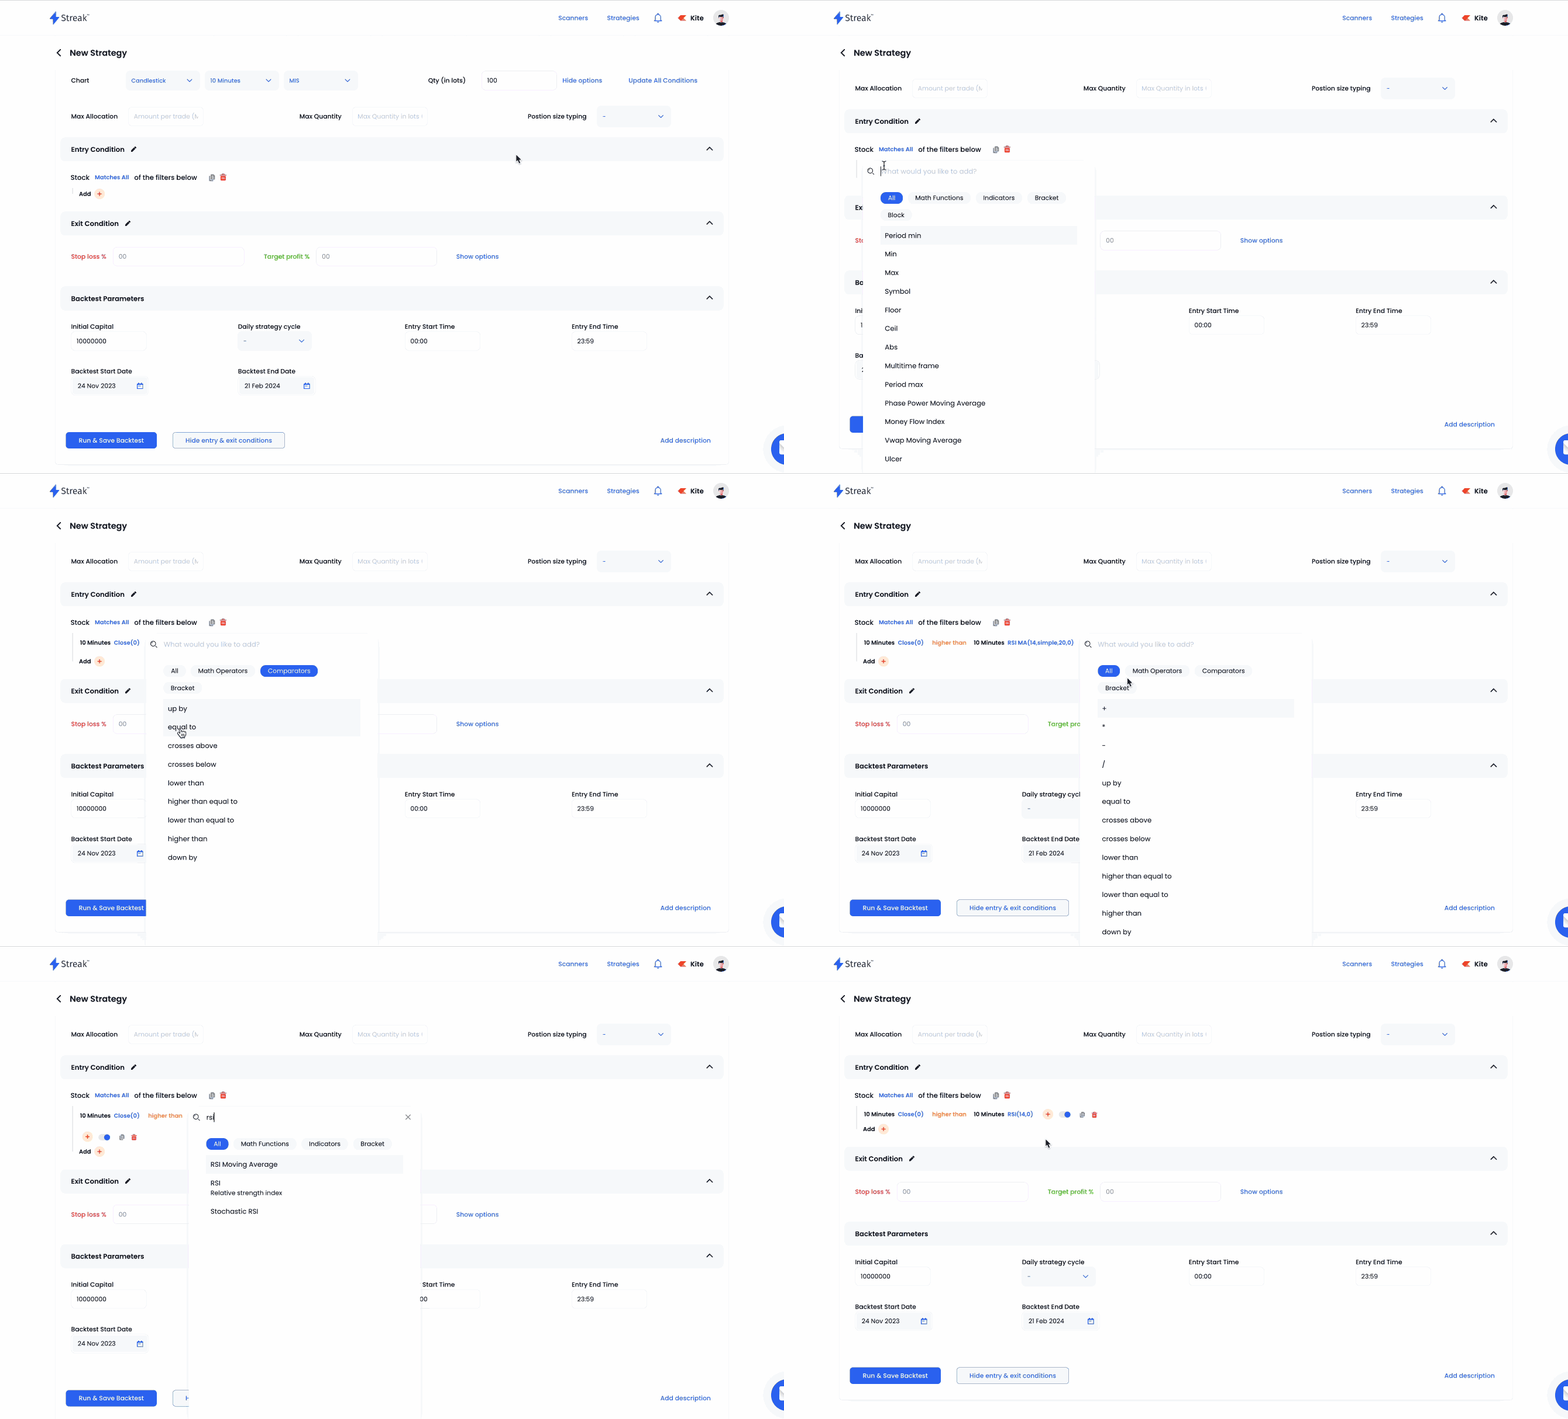
You can build your entry condition using over 80+ technical indicators such as RSI, MACD, Supertrend and more.
Step 3: Exit
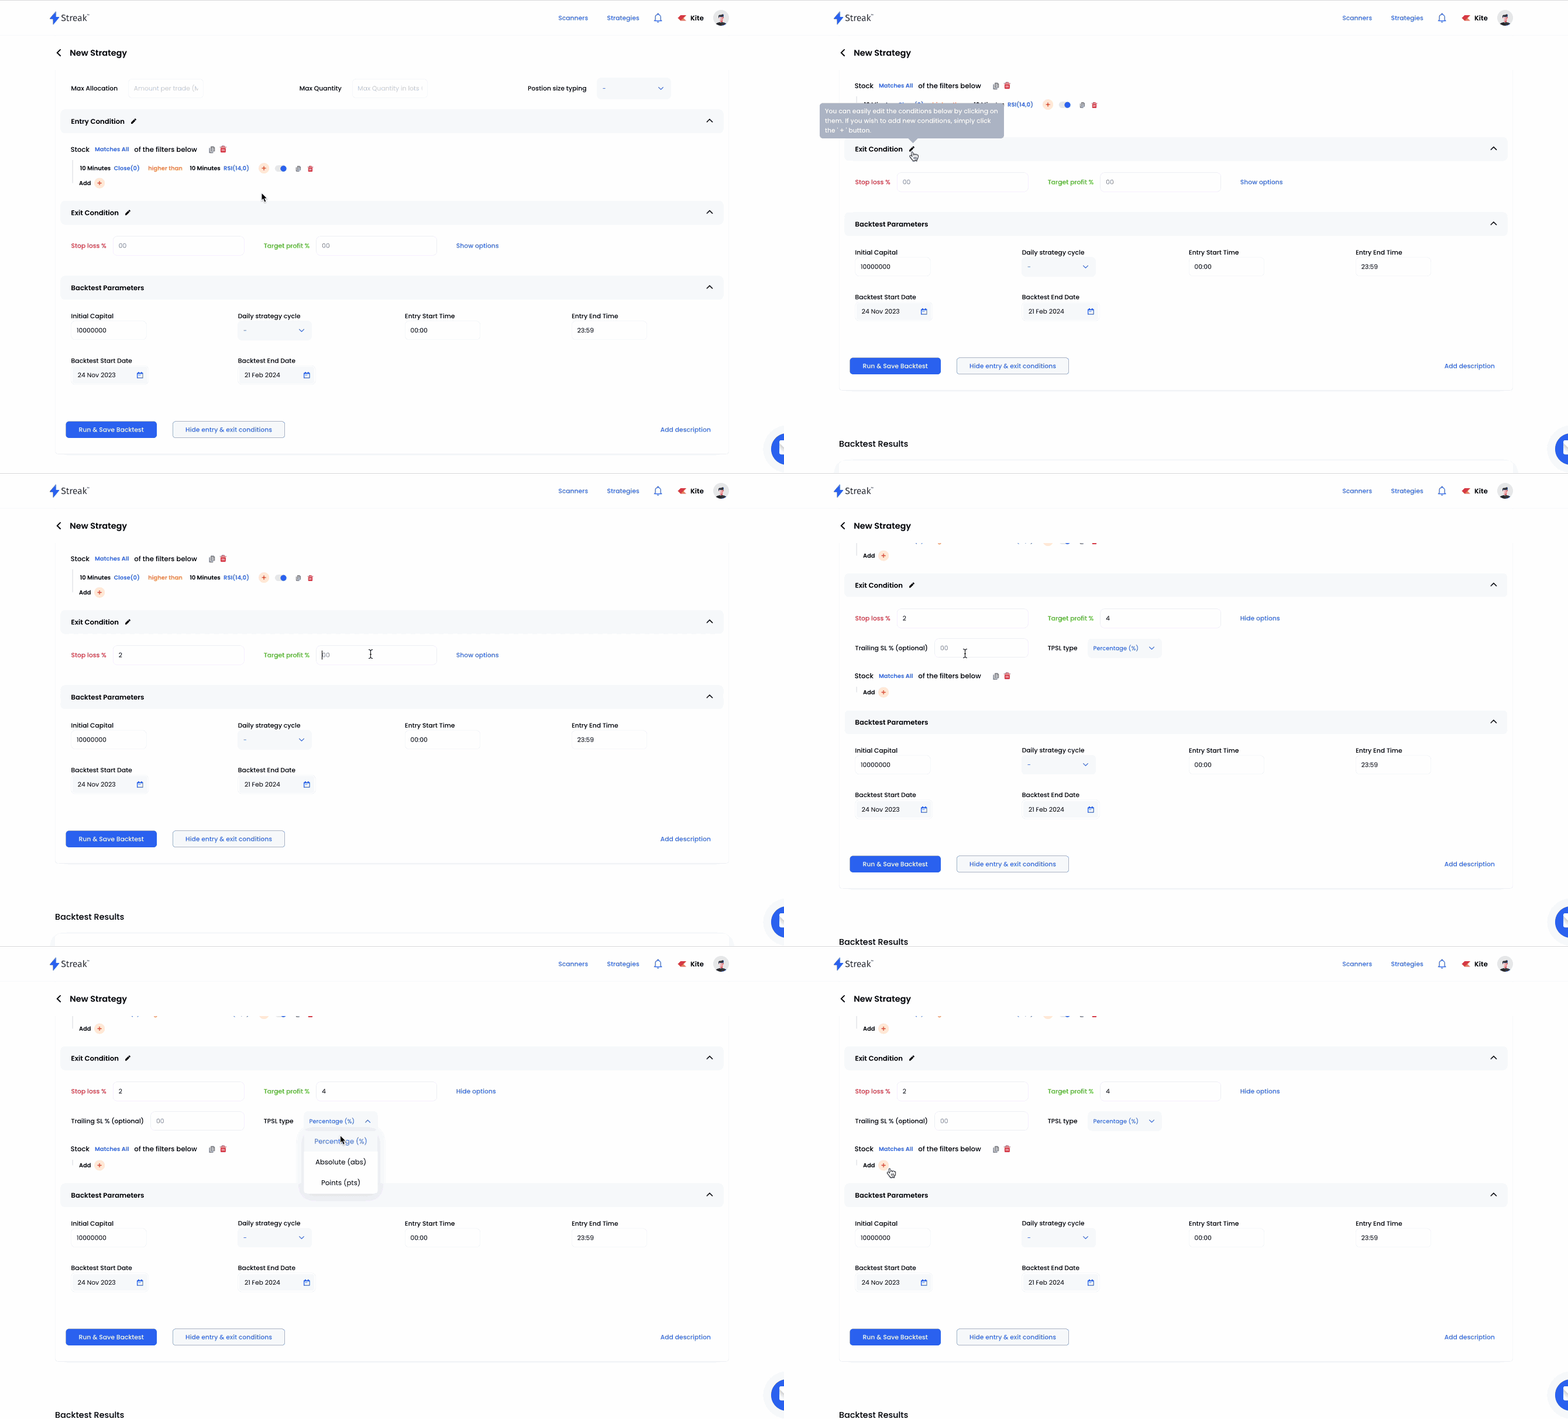
The exit condition includes mandatory Stop loss and Target Profit percentage and an optional exit condition based on technical indicators.
Step 4: Backtest Parameters
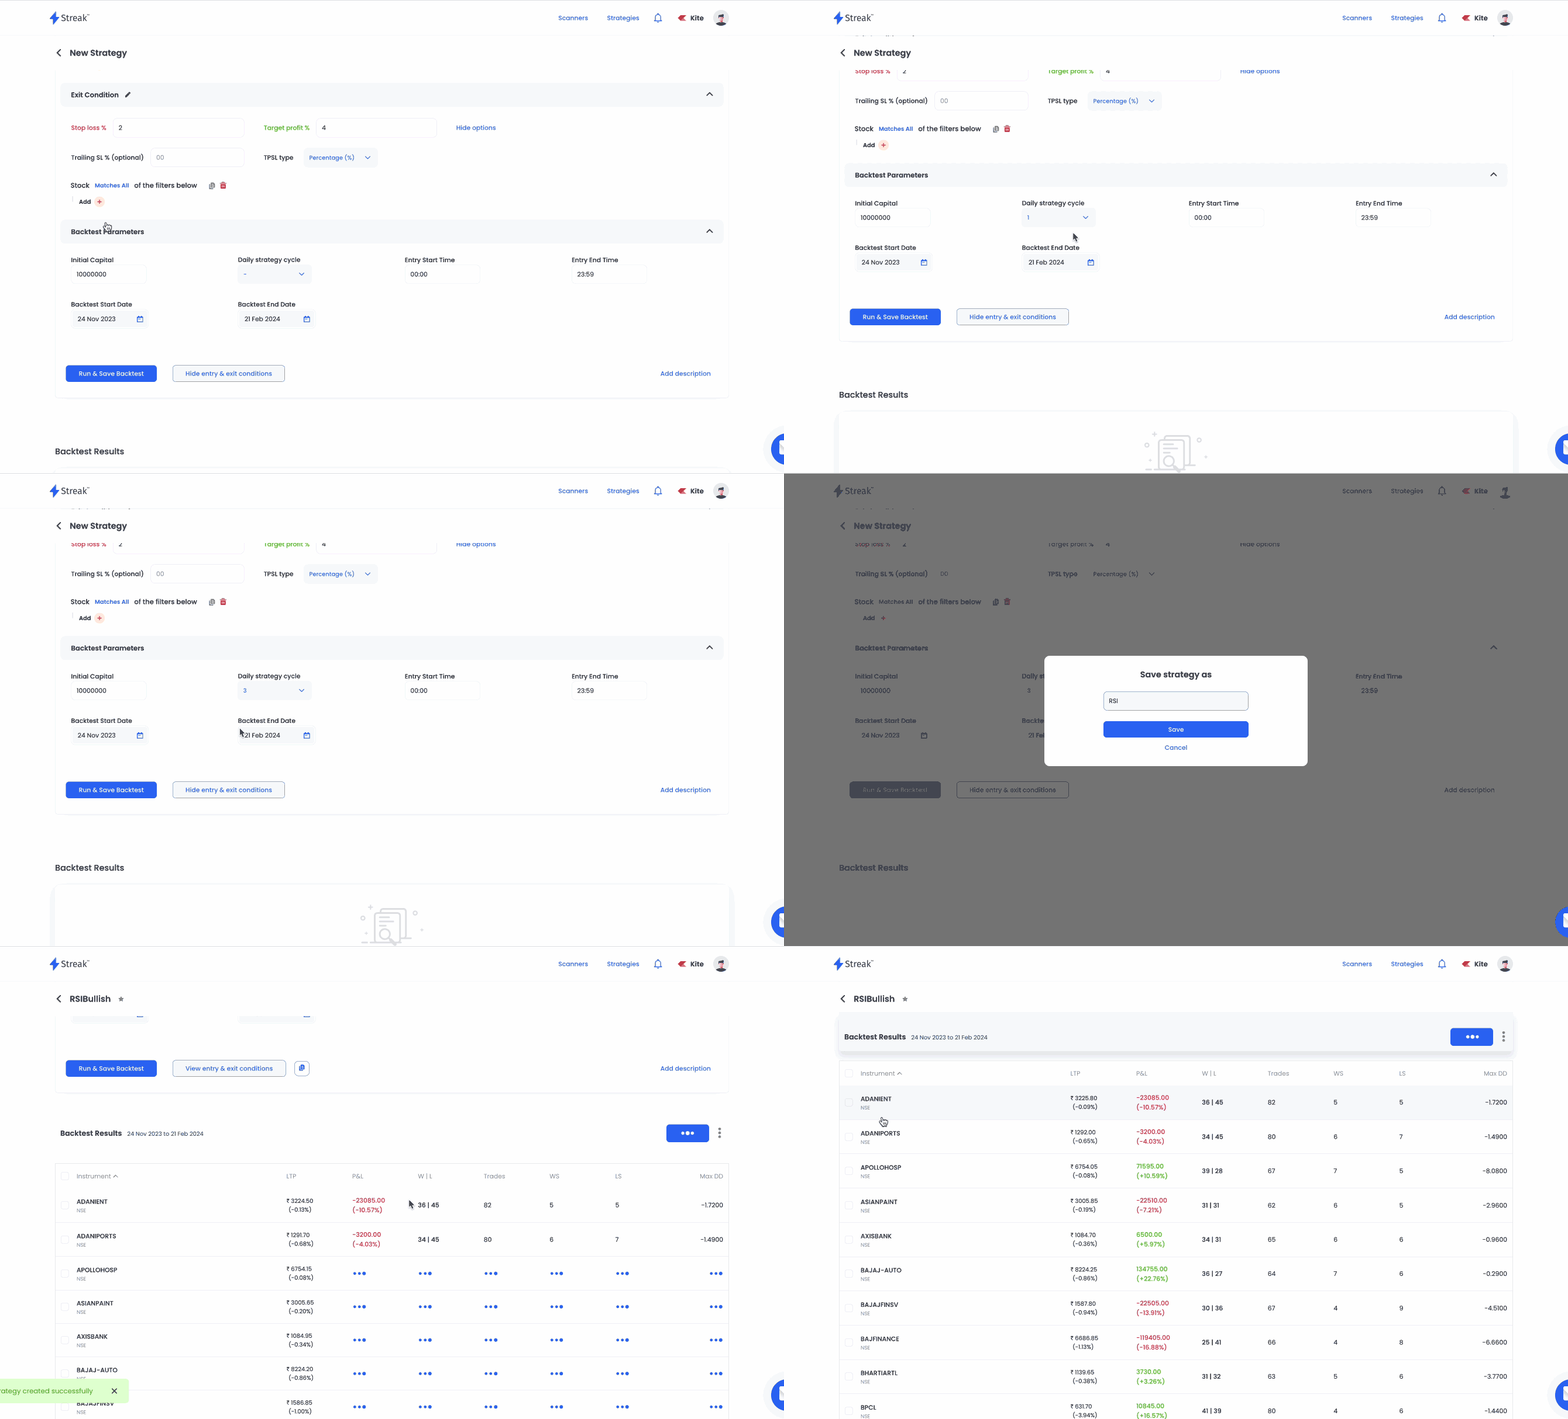
You can also change the backtesting parameters before running the backtest. These parameters are:
- Initial captial: This is the hypothetical captial required to enter a trade in the backtest period. By default the value is set to 1 crore (10000000) and it does not represent any capital held by the user and is for backtest purposes only. While backtesting an entry will only be triggered when the notional value of the trade is less than the
Initial capital + Cumulative Profit or Loss uptill previous trade. - Strategy Cycle defines the loop of the strategy i.e entry followed by respective exit.
- Entry start and stop time: This can be customized as per requirements and by default it is set as 9:00 AM to 11:59 PM
- Backtest start and stop dates: This is the duration for which the backtest runs.
Points to remember when using Entry Start and Entry Stop time
-
Given trade time is only inclusive of candle close time.
Example:
If trade entry time is given between
11:10 AM to 03:00 PMand for a 15 minute candle interval. Then for 11:00 AM candle since it closes at 11:15 AM and meets the entry condition, the trade will be executed. Similarly, for 03:00 PM candle, the close time is 03:15 PM, even if it meets the entry condition but since the trade time given was only till 03:00 PM trading signal will not be generated. -
While backtesting the close time for a candle is consisdered as 'Close time - 1 milisecond'
Example:
Candle Interval: 5 minsEntry start time: 9:20Entry stop time: 2:15Now if the entry condition is true on the first candle close (a 5min candle of 9:15, will close at 9:20), the entry will not be captured in the backtest as candle close time in backtest is assumed as "9:19:59:999".
However, for the same parameters a deployed strategy will receive the alert because the trigger will be generated at 9:20:xy seconds. Since the alert time is higher than entry start time, a triggered is generated.
By keeping the entry start time as 9:19 one shall receive alert in both, backtest and in deployment.
-
As a thumb rule, to get same results for backtest and deployments you can keep the start/stop time as below
Entry Start time:earliest signal time you want to receive the alert (minus) - 1 minuteEntry Stop time:last signal time you want to receive the alert (plus) + candle interval (plus) + 1 minute
Note
- During a backtest, if the close price crosses either of the exit price points (SL,TP) in the current candle, an exit is triggered. However, if the exit signal is met, the hypothetical exit order is placed on the open price of the next candle.
2. After deployment, for virtually deployed strategies, if the strategy has entered a position in the market and the LTP (last traded price) crosses either of the exit prices point(TP SL) or the exit signal is met, the hypothetical order is immediately placed.
---------------------------------------------------------------------------------
More on Create
Comparators
- up by/down by
- crosses above/crosses below
- lower than equal to/higher than equal to
- lower than/higher than/equal to
Detailed explanation for each of the comparators is explained here
Math operators
You can also use math operators to add, subtract divide and multiply values. Math operators are usefull for creating complex conditions. How is it helpfull?
Let's understand this with an example
Example
Suppose you want to trigger an entry when there is a rising RSI. But you don't know by what percentage the RSI should rise. Now, how do we create this condition?
Ok, first lets consider a stock moving in a straight line.
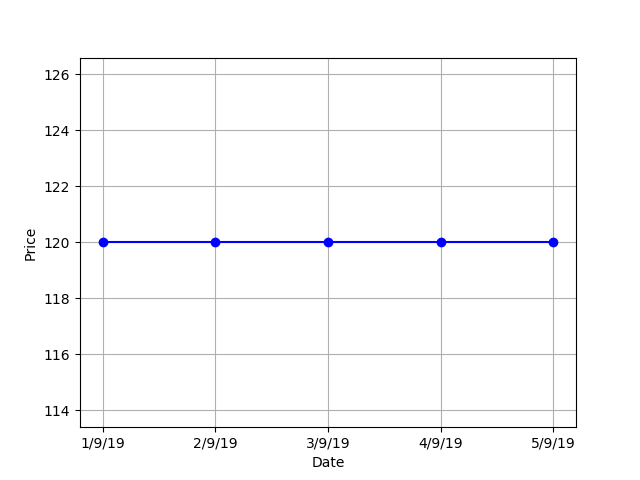 For the above stock, what is the difference between the price on September 3rd and September 2nd?
The answer is 0. So, if I were to create a condition to look for the movement like in the above chart,
I would put in the below mentioned condition:
Close(0) - Close(-1) equal to 0
Again, lets consider a stock, whose price is rising gradually.
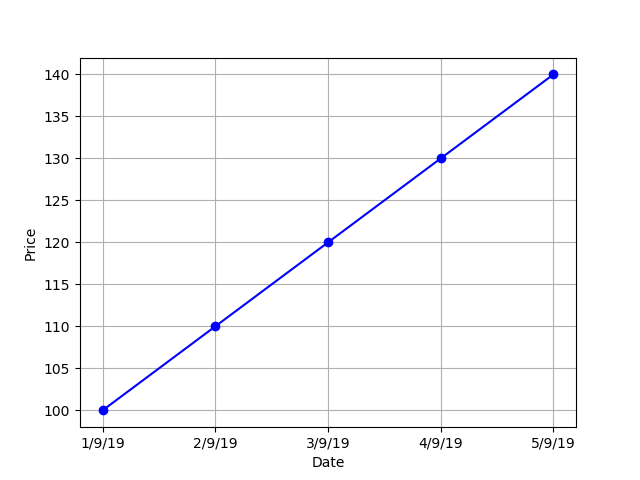 For the above stock, there is a price difference between the candles. The difference between the price on September 3rd and September 2nd = INR 10 and the difference between the price on September 4th and September 3rd = INR 10. So, if we calculate the difference between all the candle it is going to give a positive number( i.e. higher than 0). So, if I were to create a condition to look for the movement like in the above chart,
I would put in the following mentioned condition:
Close(0) - Close(-1) higher than 0
Now, we are going to use the same logic for rising RSI, we are going to take the help of indicator offset and math operator to do this. An uptrending RSI can denoted by positive difference.
Conditions:

The above expression calculating the difference between current candle RSI and previous candle RSI and checking whether this is higher than 0.
Math Functions
Period Min and Period Max 
Period Min: The period min function returns the item with the lowest value within stated period. This function takes in two arguments, one is the period and the other is a variable that users want to compare Period min(Period, Variable). It will process all the values mentioned for the period number specified and return the minimum value.
Example
Entry on:SBIN Time frame:1 day
Conditions: Close(0) lower than Period Min(5, Low(-1))
The above query would generate a entry trigger on SBIN, whose current candle close price is lower than lowest low price of the past five days.
Period Max: The period max function returns the item with the highest value within stated period. This function takes in two arguments, one is the period and the other is a variable that users want to compare Period max(Period, Variable). It will check through all the values mentioned for the period specified and returns the maximum value.
Example
Entry on:SBIN Time frame:1 day
Conditions: Close(0) higher than Period Max(5, high(-1))
The above query would generate a entry trigger on SBIN, whose current candle close price is higher than highesh high price of the past five days.
Min and Max 
Min: The min() function compares two variables and returns the item with the lowest value. This function takes in two variable arguments, that users want to compare Min(Variable, Variable). This is different from Period min as this consider two variables instead of one. The min function is especially helpfull when you want to compare two independent conditions.
Max: The max() function compares two variables and returns the item with the highest value. This function takes in two variable arguments, that users want to compare Max(Variable, Variable). This is different from Period max as this consider two variables instead of one. The max function is especially helpfull when you want to compare two independent conditions.
Ceil and Floor 
Ceil: The ceil() function approximates the given number to the smallest integer, greater than or equal to the given float value. This function is helpful when creating conditions that involve calculation of value and you are unsure about the result. This function rounds up the value to the nearest largest integer. Ceil(5.678) would be rounded up to 6.
Floor: The floor () function returns the largest integer less than or equal to the given number. Similar to Ceil function, this function lets you round off the value to the nearest largest integer. Floor(5.678) would be rounded off to 5.
Abs
The abs() function is similar to mod function and is used to return the absolute value of a number. abs(-6) and abs(6), both would return the absolute value of 6.
Multi-Timeframe Functions
Multi-Timeframe (MTF): The multi timeframe() function allows users to perform multi timeframe analysis i.e check conditions for two different timeframes in a single query.
Note
MTF calculates value of larger timeframe indicator values on partial candles (since the larger timeframe candle takes more time to form). When MTF is used for backtesting, it can have look-ahead bias and live alerts may not always be verifiable with charts or match when backtested. This is because it is not possible to predict future OHLC values and indicator. You should test your strategy and understand the backtest result charts and not just deploy it on the basis of Profit/Loss.
Multi-Timeframe Completed (MTF-Completed): The multi timeframe Completed() function checks for completely formed candle(of same or larger timeframe). Unlike the MTF, MTF-Completed does not consider Partial candle information and does not have a look ahead bias.
If you create a condition as Close(0) crosses above Multi-timeframe completed(day, Supertrend(7,3,0)), then it will compare current candle’s close with the Supertrend on a completely formed day candle i.e yesterday’s Supertrend value. So Multitime-frame with offset of -1 = Multitime-frame completed
Example
Suppose, you want to create a query where you want to create a strategy and take an entry when the stock is a. trading above 10 EMA on a daily timeframe, and b. hourly RSI is above 50, and c. MACD is giving a buy signal in 5 min timeframe
Candle Interval:5 min
Conditions:

Symbol
The Symbol function allows users to check their conditions on another scrip/symbol than the one selected under the instrument section in the create strategy page. This function takes in two arguments, one is the scrip and the other is a variable that users want to compare Symbol(scrip, variable). Inside the variable one can add the required conditions and whatever is added within the symbol bracket, all those conditions will be checked on the selected scrip itself and trade will be triggered for the stocks, options or future contract added in the instruments section.
Brackets
Brackets are used to denote and group sub-expression. Bracket follow BODMAS rules. It allows you to exactly create your ideas the way you want.