Strategies
Streak has a collection of over 150+ pre-built strategies based on technical indicators for equities, futures and options. You can filter strategies based on timeframes, chart type and whether you have a bullish view or bearish view.
All the strategies created by the user are under "My Strategies". This also includes strategies that you have edited or copied from "Discover Popular Strategies".
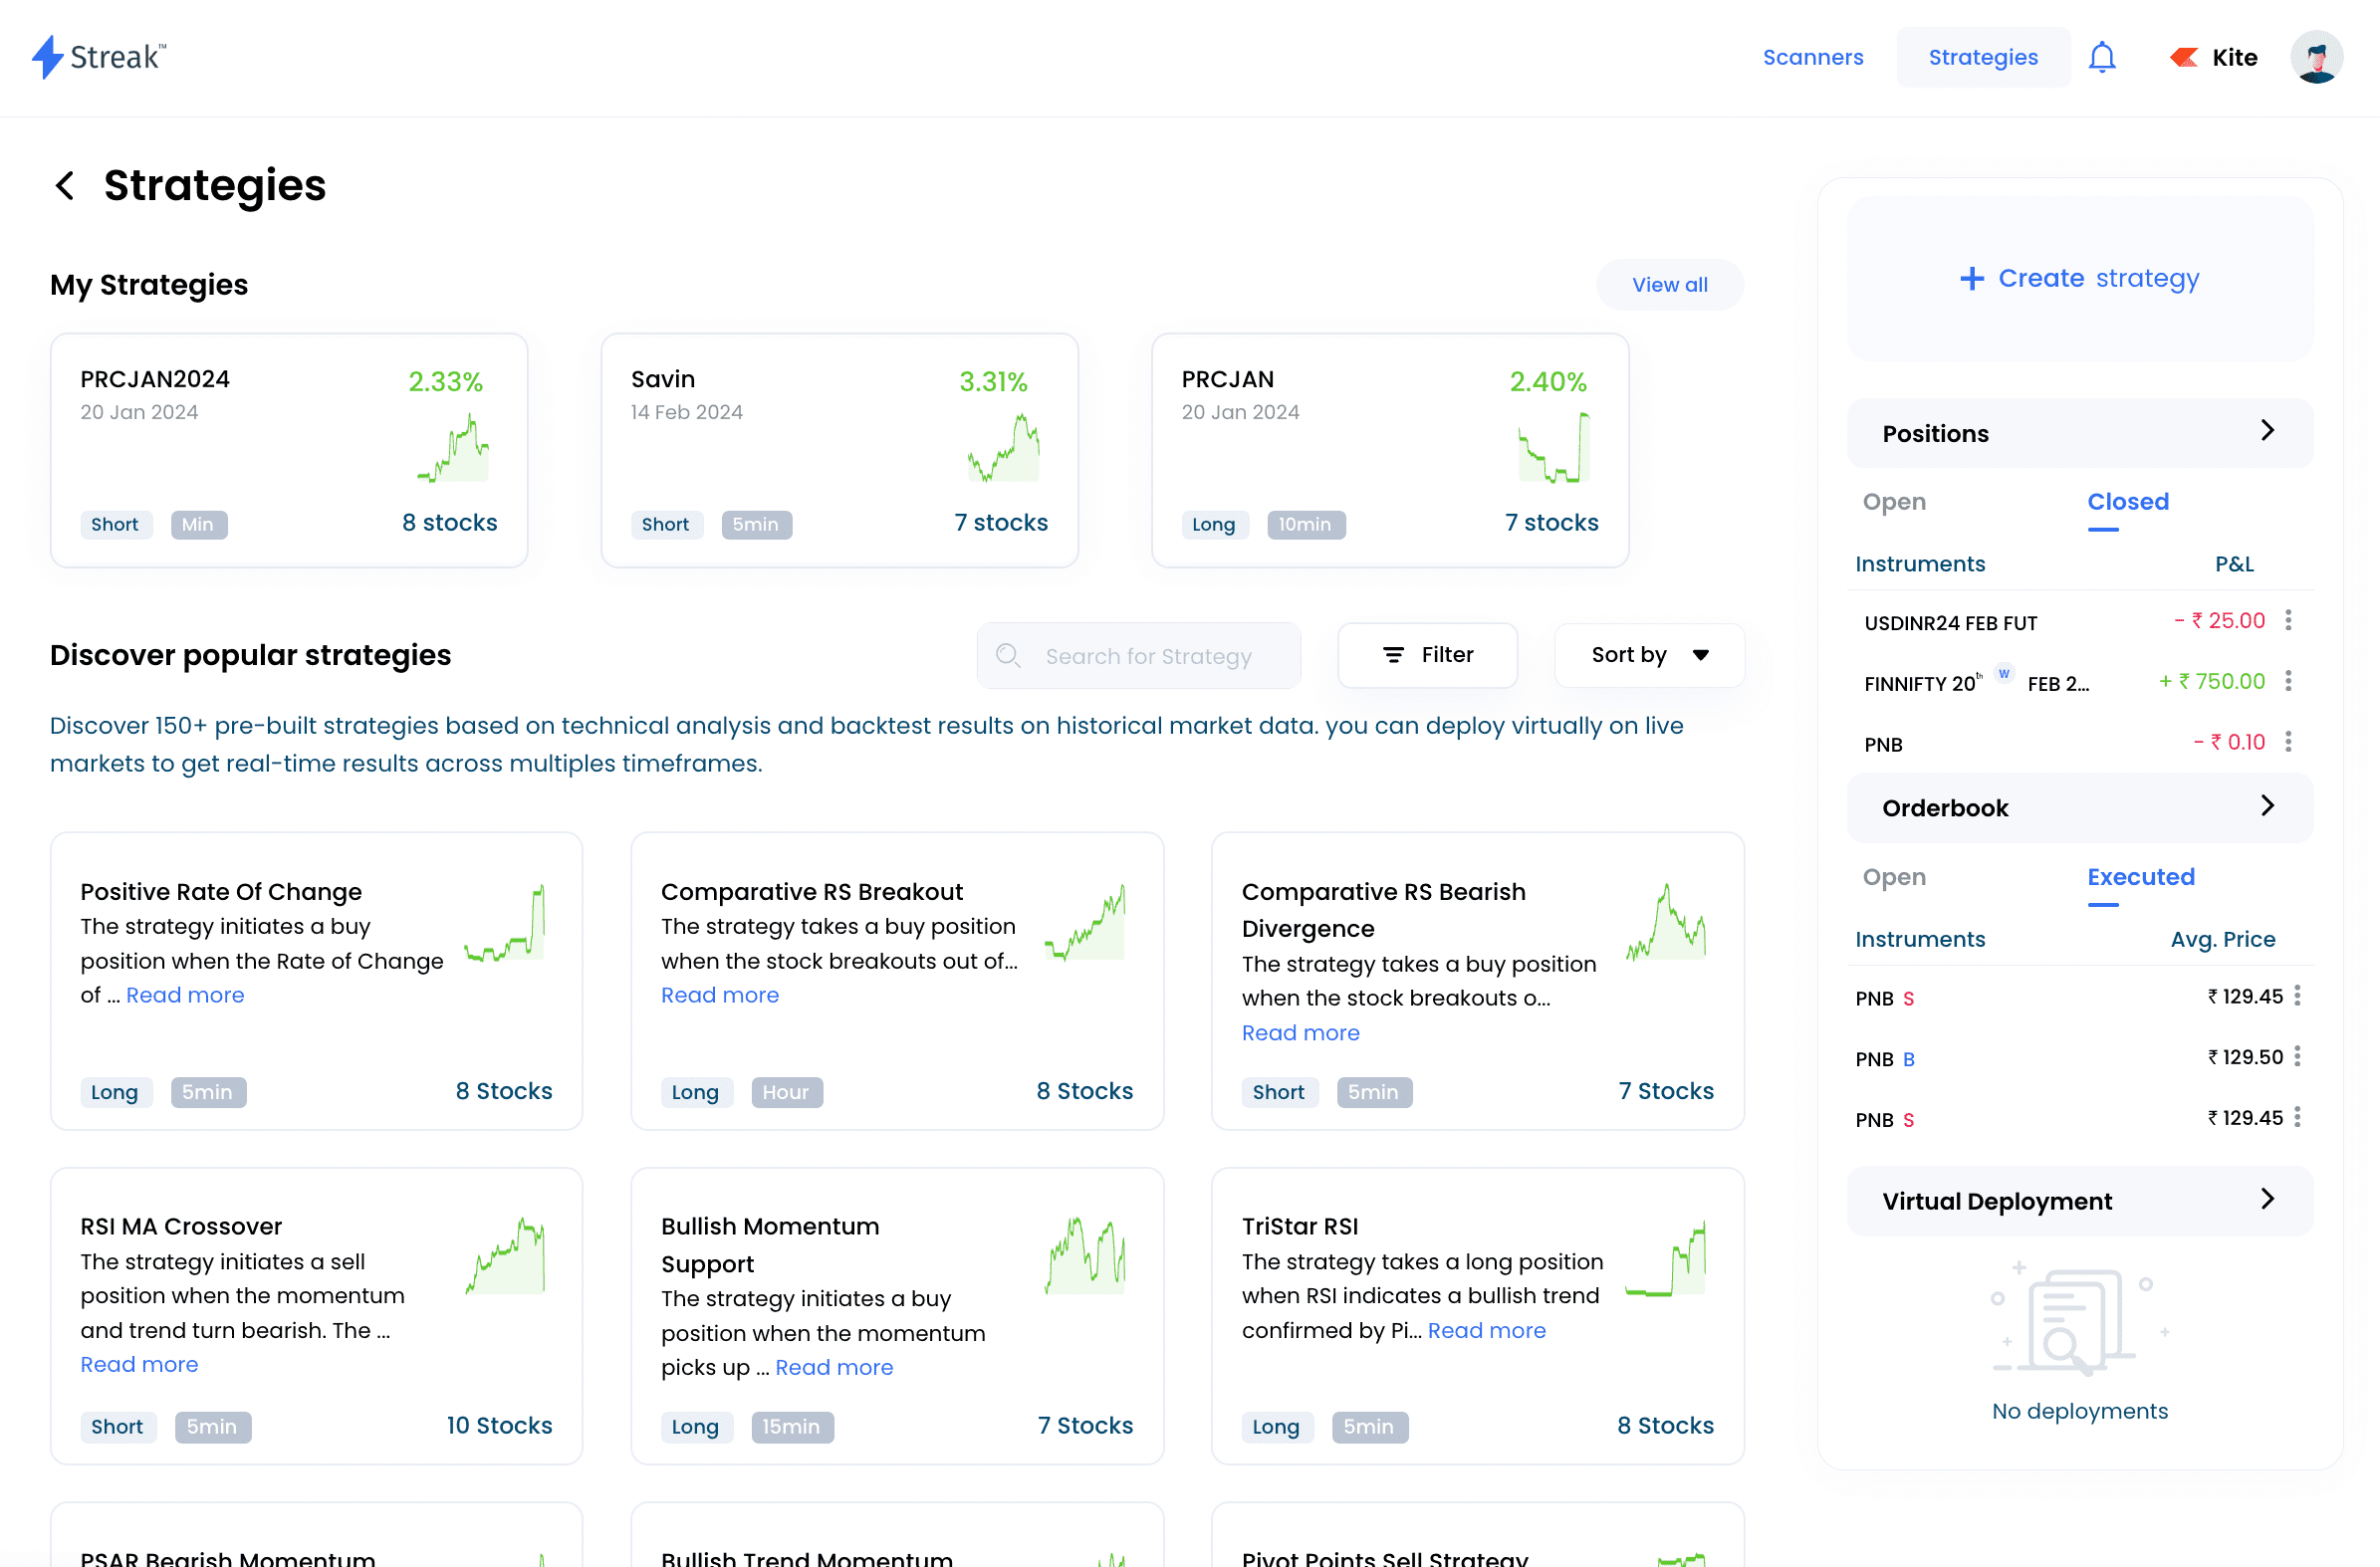
Click on any strategy to see its backtest results.
Backtest
Backtesting is the process of applying a set of rules to historical data with the goal of assessing the strategy's effectiveness in generating profit.
Streak has the most powerful backtesting engine in the world that generates performance metrics for multiple stocks in a single click.
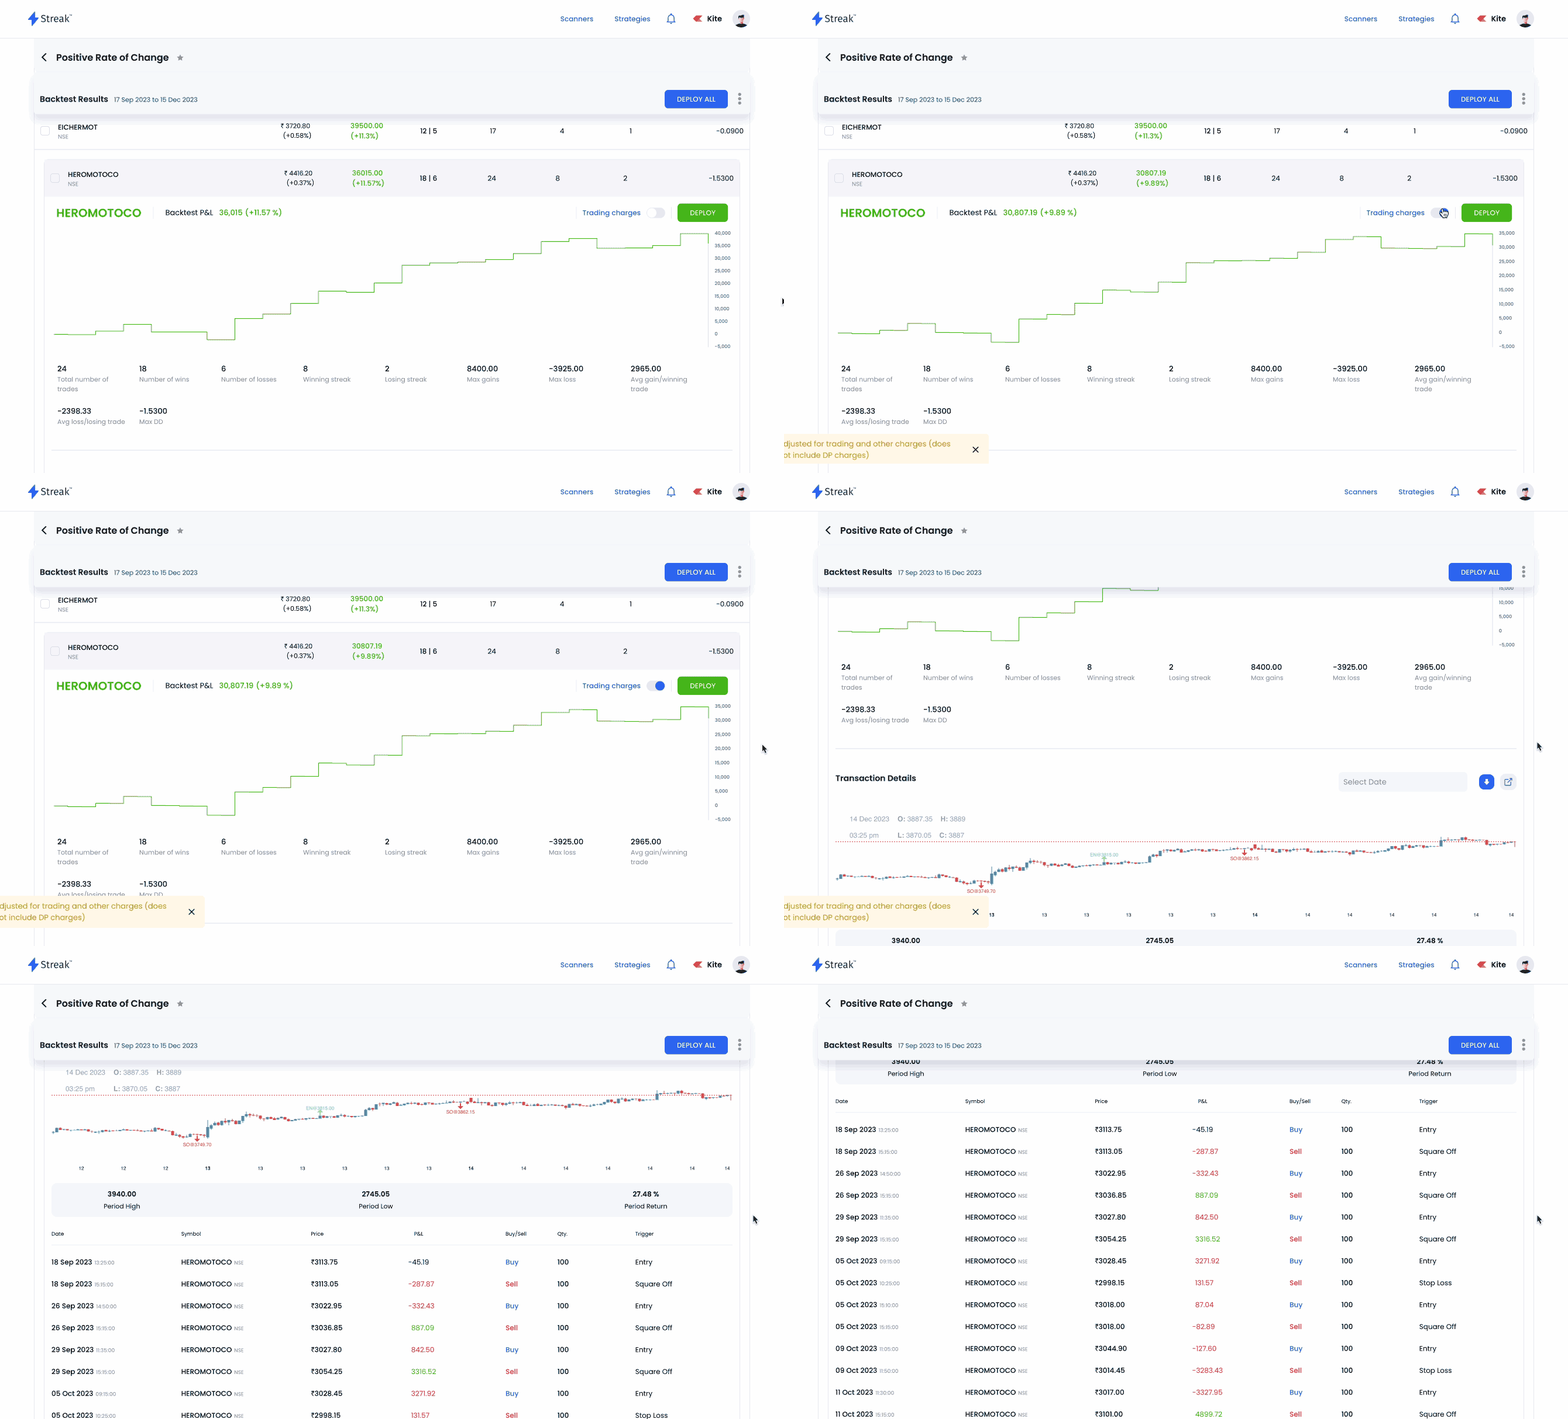
The backtest results include Profit and loss curve, maximum gains/losses, average gain per winning trade, average loss per losing trade, maximum drawdown and much more. These metrics give you a comprehensive idea of your strategy performance before you deploy in the market.
You can easily copy existing strategies and edit them to make your own strategies. Once you make your changes, save the strategy with a name and run the backtest. You will get the latest results which you can explore. You can also create a new strategy from scratch by clicking on "Create Strategy".
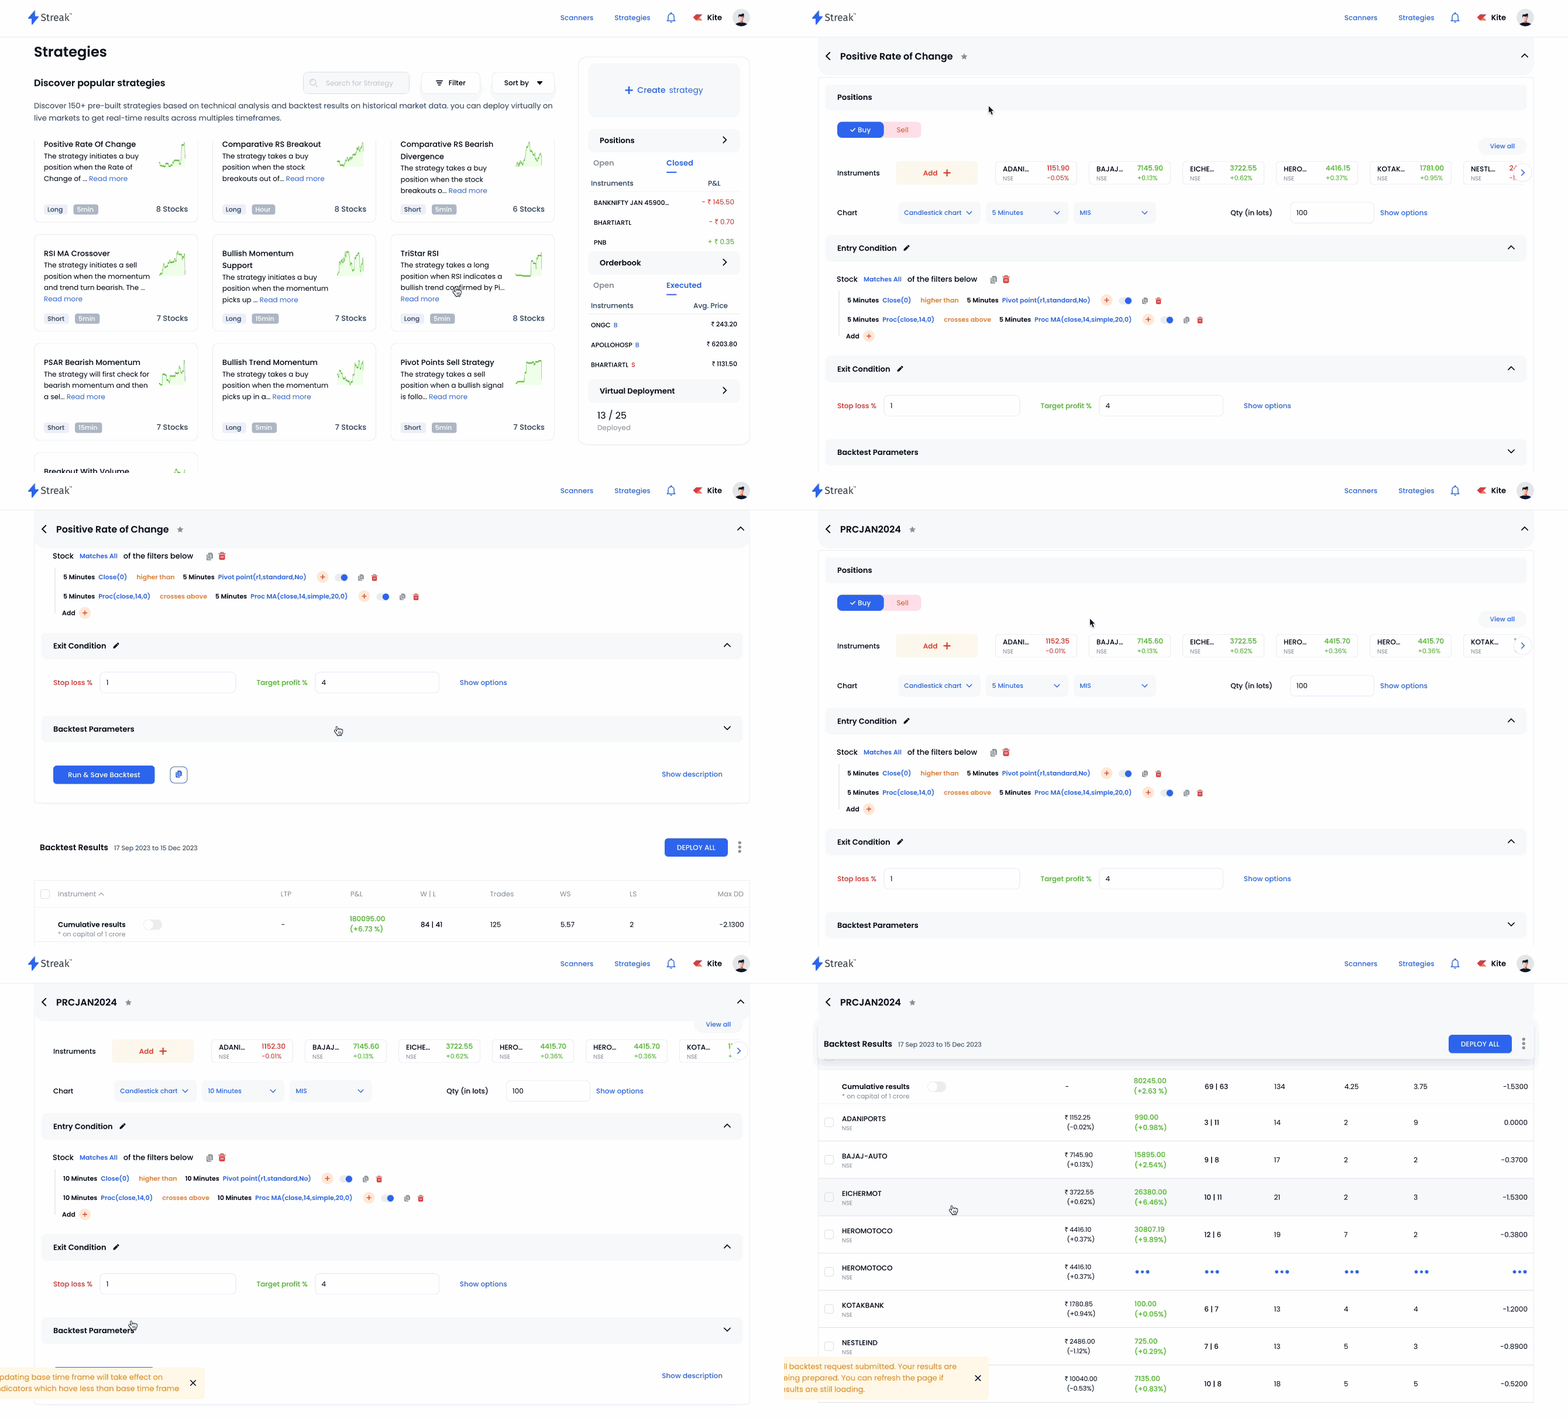
Backtest Results1
On clicking the "Run Backtest" button, a fresh backtest is run for each instrument by first fetching all the appropriate historical market data for the respective stock/contract and initializing all the user defined parameters. The historical market data is then processed to generate hypothetical trade signals and hypothetical trades are performed using the hypothetical initial capital.
Based on these hypothetical trades, certain performance metrics such as hypothetical profit/loss, winning streak, losing streak etc. are generated in an effort to provide a generalized and simplified understanding of the strategy’s hypothetical returns and risk.
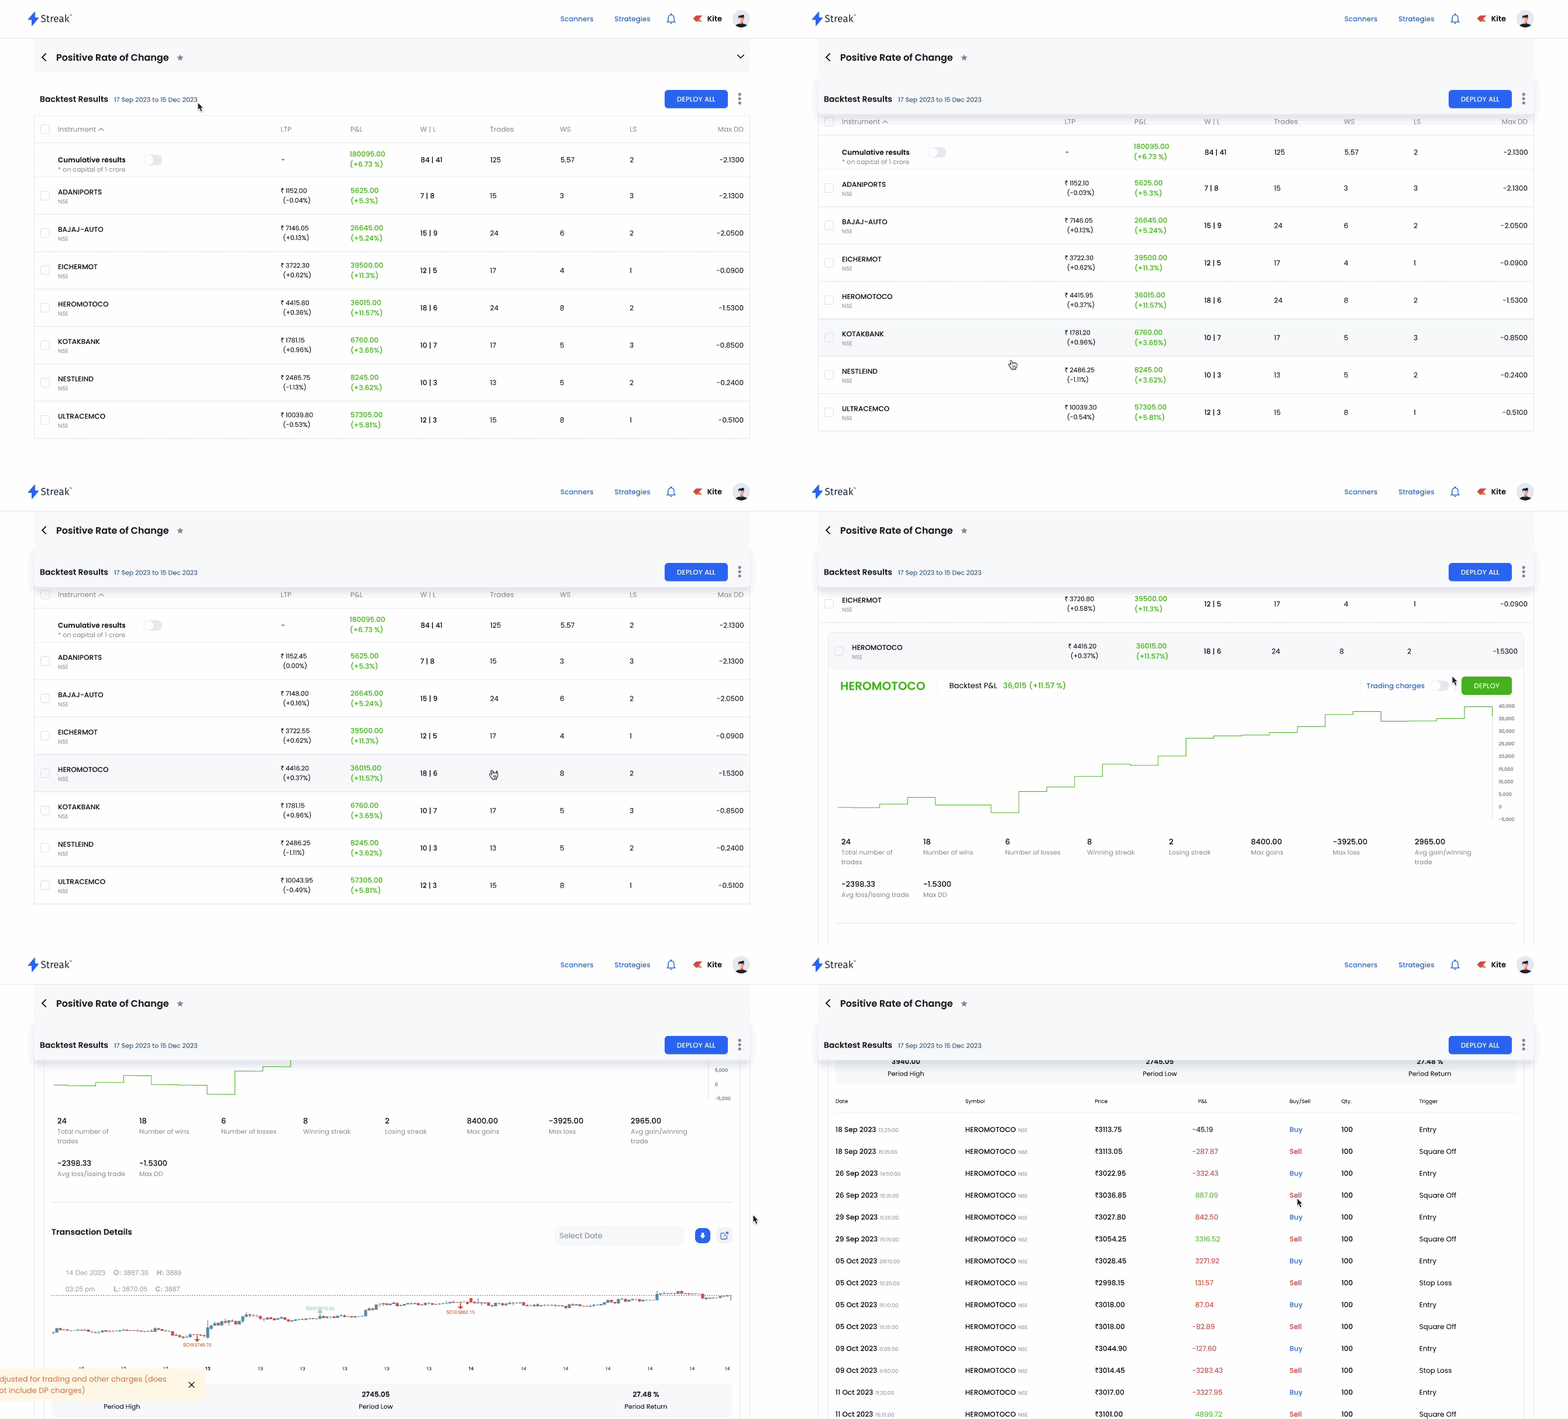
-
P&L : The cumulative P&L realized after taking all the trades generated through the strategy.
-
Wins vs Losses (W vs L) : Displays the number of trades that ended up being profitable and the ones that weren’t. This important piece of information can help you decide whether your Risk/Reward ratio based on stoploss/profit-target & average loss/losing trade v/s average gain/winnig trade is favorable or not.
-
Winning Streak (WS): The highest number of subsequent winning trades, one after another.
-
Losing Streak (LS): The highest number of subsequent losing trades, one after another.
-
Max Drawdown (Max DD): Max drawdown measures the largest decline in the P&L curve at any given point of time.
More on Maximum drawdown
Maximum drawdown (Max DD) is the maximum loss from the peak (highest point) to a trough (lowest point) of a PnL chart, before a new peak is attained. It signifies downside risk and is calculated by measuring the highest fall (largest loss) in over a specified time period.
It is important to note that Max DD only measures the size of the largest loss among all the loss during a period. It does not consider the frequency of losses.
A max dd of 0.97 is better than 1.53. Similarly, a max dd of -0.12 is better than -0.93. The lower the value, the better. It should ideally as close to 0 as possible. If a strategy never made a loss making trade, the Max DD would be zero.
Transaction details
All the hypothetical trades generated are shown in the transactions table along with entry/exit price and profit/loss for each hypothetical trade.
You can also download the transaction details for each symbol present in the strategy.
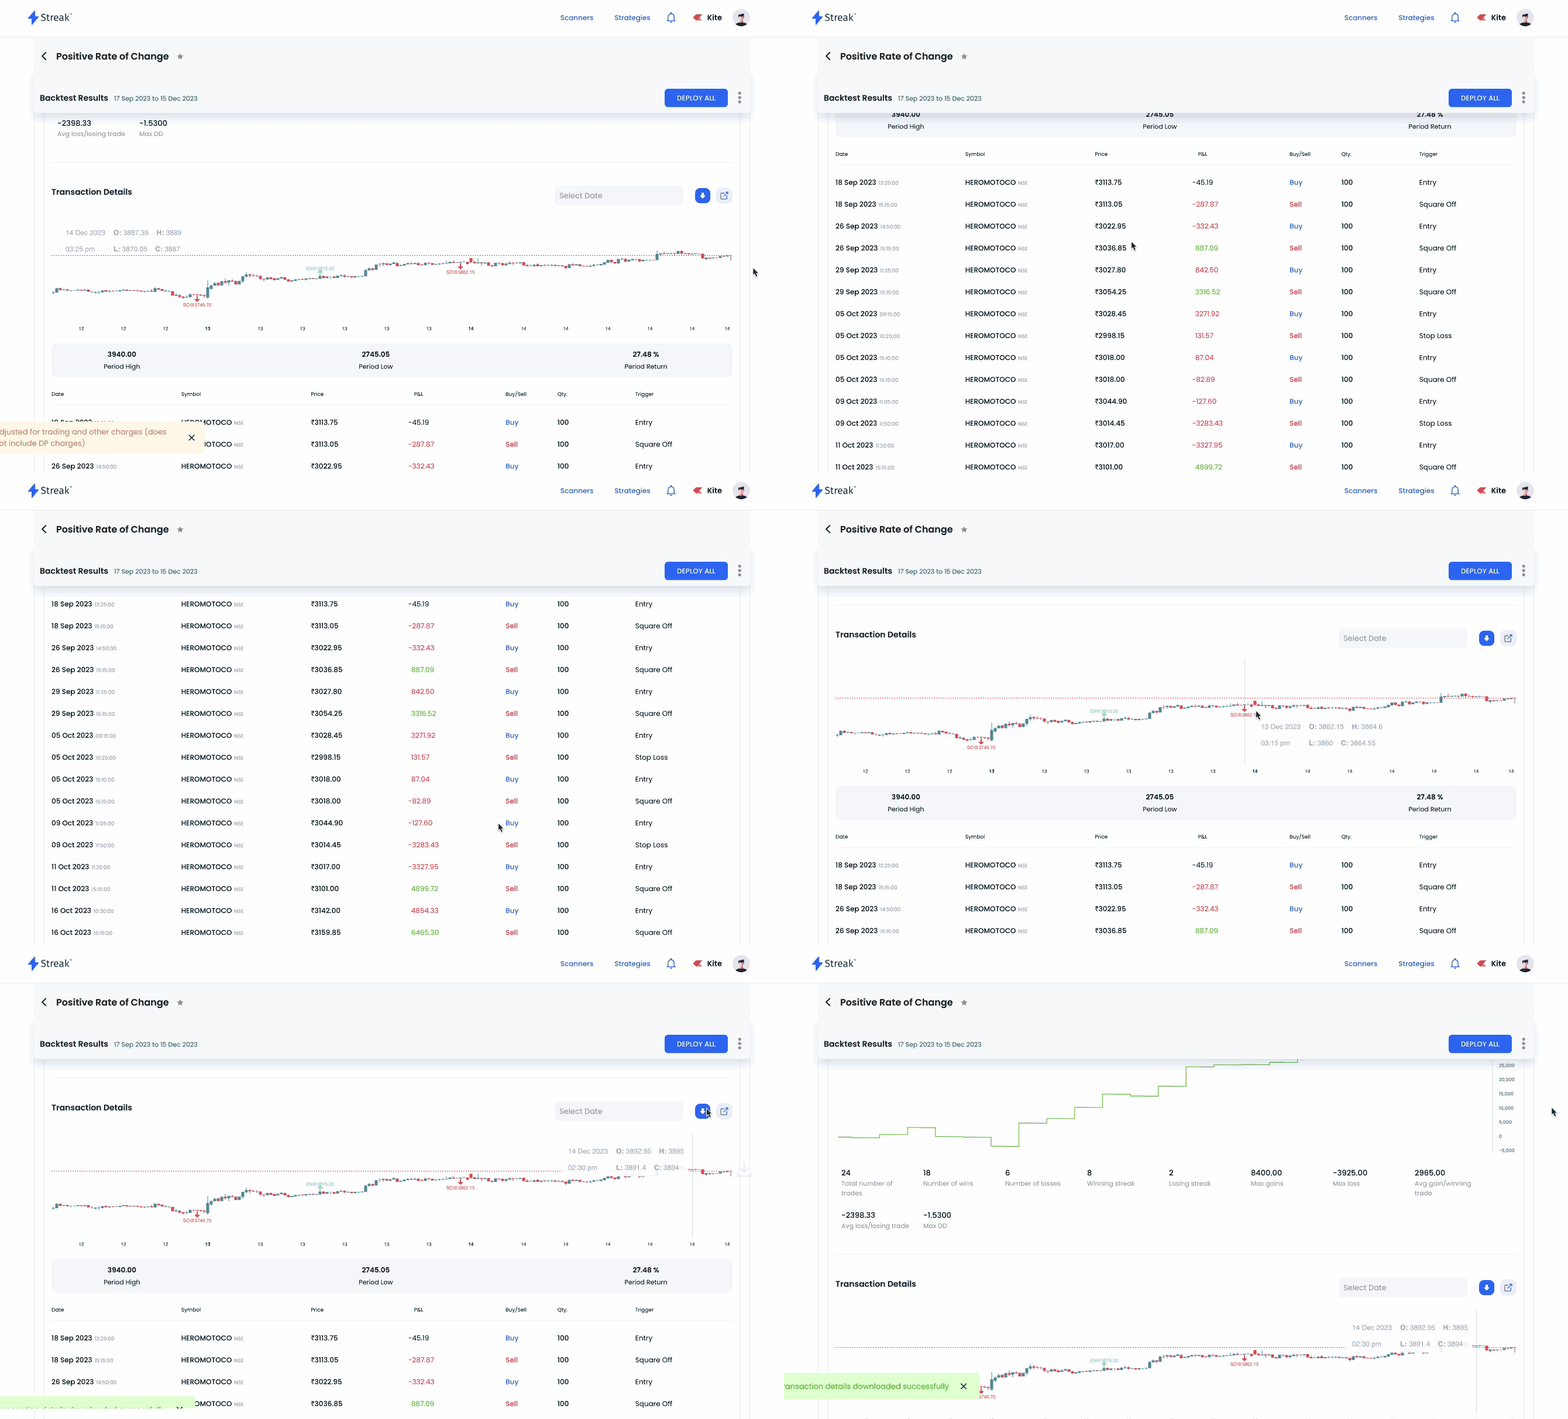
Trigger Types:
- EN - Entry
- SL - Stop Loss
- TP - Target Profit
- SO - Square off
- EX - Exit condition
- TSL - Trailing Stop Loss
- EXP - Contract Expired
Trading Charges
Trading Charges account for all the deductions as per brokerage calculator on your broker's website. Brokerage charges include broker's brokerage, STT, transaction charges, GST and SEBI charges.
Backtest error messages
During a backtest, if any error occurs/proper results are not be generated, the platform shows appropriate messages to help the user adjust the input parameters and run the backtest again. These error messages are explained below:
1. No trades happened - This means that no hypothetical entry signals were generated for the strategy and no hypothetical trades were performed for the backtest period selected by the user. This could mean that the strategy conditions were never met in the specified backtest period or that the conditions were syntactically/logically incorrect or were not expressed properly with the right indicator parameters.

2. No trades happened because initial capital is low - This means that the strategy conditions were met and trading signals were generated but due to insufficient hypothetical initial capital, hypothetical trades were not generated. It can be resolved by increasing the hypothetical initial capital or by decreasing the quantity and running the backtest again.

3. Limit Exceeded - This means while running backtest you have reached your daily maximum allowed backtest limit.
4. Error while fetching data - This means that an internal error occurred while fetching historical data. It can be resolved by waiting for a few minutes and running the backtest again. If the backtest counter gets decreased, you can write to us and we will allow few additional backtests.
5. Server timed out - This means that the user's browser is not able to connect to Streak servers due to an internet connection error. It can be resolved by checking the internet connection and running the backtest again.
Info
Backtesting on Streak: Backtesting on Streak allows users to measure the hypothetical performance or returns of an strategy. All backtest results are a hypothetical representation of the performance and returns on an strategy, based on certain underlying assumptions. These results do not provide any guarantee of future performance or returns, and all strategies are subjected to market risks.
Backtest assumptions
During a backtest, hypothetical trades are generated with the following high level assumptions:
- During a backtest, irrespective of the order type, no margin is assumed for any instrument. The user must enter the desired initial capital value such that it is higher than the product of quantity and the instruments close price [Initial Capital >= (Quantity x Close Price) for all instruments being tested].
- During a backtest, any hypothetical signal to buy or sell is executed on the open price of the next candle irrespective of the actual volumes traded for that candle in the historical data.
- During a backtest, no form of averaging is done i.e., the strategy does not take multiple consecutive entry positions before exiting the current position (entry position is taken only after the previous position has been exited i.e., when quantity at hand is zero).
- During a backtest, the strategy will only exit a position, when either the exit condition is met or when target profit/stop loss price or trailed stoploss price is hit, or position is squared off for MIS holding type
- During a backtest, there is no context nor is any consideration given to corporate actions such as stock splits, rights issues etc. and no adjustments are made to stock/contract prices. The values OHLCV (Open , High, Low, Close and Volume) are taken directly as present in the historical candle data.
- During a backtest, a hypothetical entry/exit is generated only if the condition is false in the previous candle and is true in the current candle.
- During a backtest, the profit/loss are calculated on the TP SL % and the PNL chart values are calculated on the Close price of every candle when a position is held, not only on buy/sell.
- During a backtest, if the holding type is MIS, all open positions are hypothetically squared off at the open price of the 3:15 pm candle (for equity) 4:30 (for currency). This is done to simulate a square off done by the brokers for MIS orders.
- Chart data is subjected to minor variations from market time to post market times due to standard data adjustments.
- Position sizing doesn't assume any margin requirements or leverage. It uses allocation and instrument price directly to calculate the order quantity. You should enter the allocation value such that margin requirements are being satisfied in your trading account for live trades. Margin calculation is done by the broker. To check the margin requirements, visit your brokers' website.
- During a backtest, quantity freeze is not consisdered, that is, hypothetical trades will be executed even when the quantity is higher than Freeze quantity (maximum quantity for a buy/sell order set by the exchange).
- During a backtest, when a long position is enterted, to track Trailing SL (TSL), the candle Sequence is assumed as O>>L>>H>>C i.e the Low is assumed to come first, followed by the High and the Close (OLHC)
- During a backtest, when a short position is enterted, to track Trailing SL (TSL), the candle Sequence is assumed as O>>H>>L>>C i.e the High is assumed to come first, followed by the low and the Close (OHLC)
- While backtesting an entry will only be triggered when the notional value (Trade price * Quantity) of the instrument is less than the 'Initial capital + Cumulative Profit or Loss uptill previous trade'.
- While conducting a backtest, the system by default checks the SL/TP on the entry candle. The system primarily checks if the SL is breached first and then whether the TP is hit. In the event of both SL and TP being triggered in the same candle (due to the candle range being huge or the SL/TP values being very narrow), it is assumed that the SL was breached first.
Note
If 5 scrips have been added and backtest is run, the counter will be updated as 5 backtests run and the count will be reduced. If no new equities/contracts have been added and backtest is run, the backtests are re-run on all the equities/contracts irrespective of its previous status.
Every time you change a parameter mentioned above and run backtest, the backtest count reduces
Deploy
With Streak you have the ability to Virtually Deploy your backtested strategies. Virtual Deployment allows you to place hypothetical trades based on real-time stock market prices. This is most helpful if you want to test your strategy on out-of-sample data (new data / Forward testing) or if you are trying out Streak for the first time or if you are new to the stock market.
Virtual Deployment enables you to test the potency of your strategies without risking any real capital. After deploying a strategy virtually, you can monitor the performance of your strategy and receive notifications when it enters and exits automatically and showcases the hypothetical P&L for the strategy.
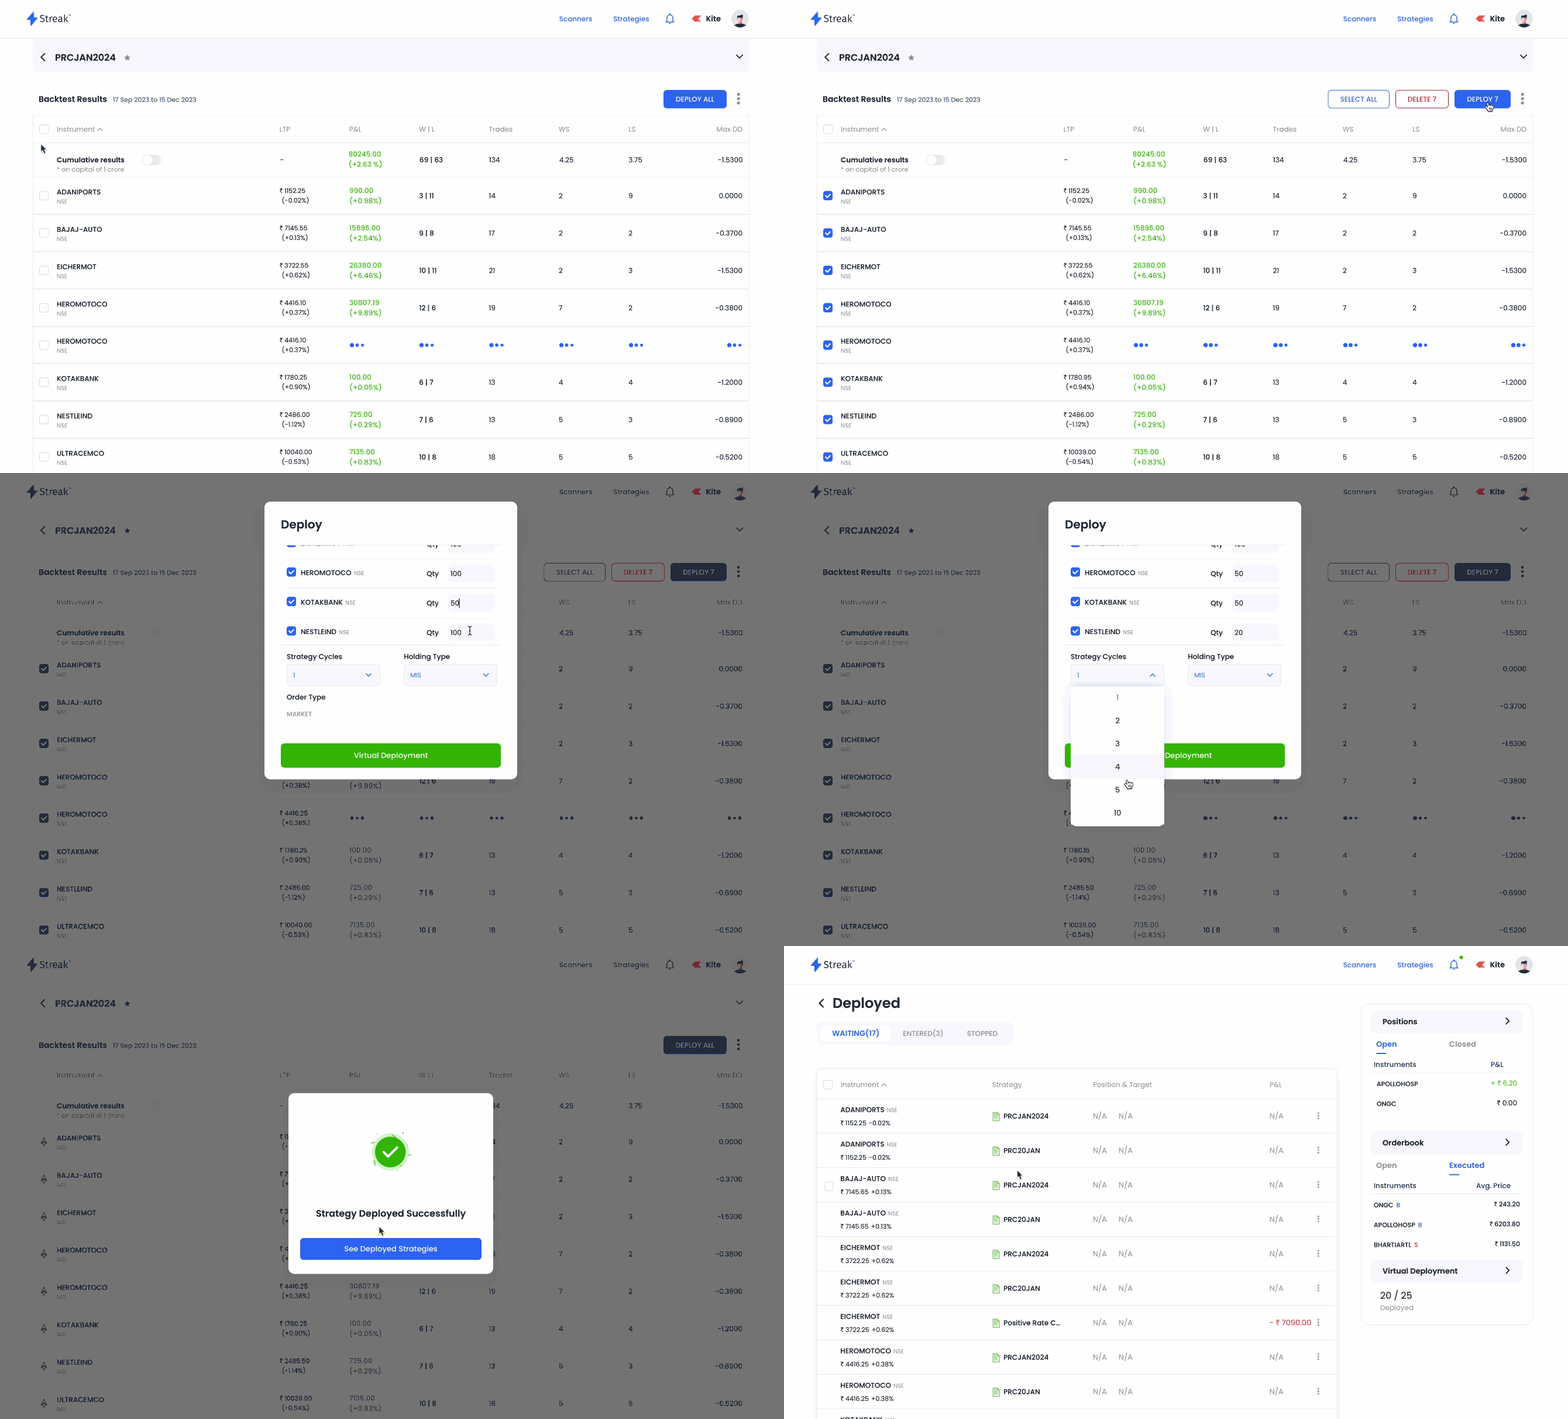
On clicking the "Deploy All" button, a popup is rendered with a summary of selected scrips and quantity used while backtesting. You can edit these parameters and instruments and click on "Virtual Deployment" to deploy it.
Strategy cycle
Strategy Cycle defines the loop of the strategy i.e entry followed by respective exit. The user should select the field "Strategy cycle" while deploying, which determines the cycles for which the strategy will be live. If you select the strategy cycle as 5 the strategy will move to a stopped state after completing the five cycles. Currently the maximum cycle that can be selected is 5.
Holding type
If "MIS" is selected, the holding type will be intraday and the strategy will be live for that single day. MIS positions are squared off and strategies are stopped after market close. If the user selects "CNC/NRML", the holding type will be CNC for equities and NRML for future and option contracts and the strategy will be live for the next 7 days in waiting state (or until the strategy is stopped by the user or terminated due to some reason such as order rejection).
Deployed Strategies
Deployed Strategies shows you all the strategies that were virtually deployed by you in any given day. All active CNC strategies which are in waiting or entered state are also shown here.
Deploy Count
You can have upto 5 concurrent strategies live in the waiting and entered state. If you deploy one strategy which has 2 instruments inside it, the deploy count will reduce to '2/5'. Indicating you now have 3 concurrent deployments left out of 5.
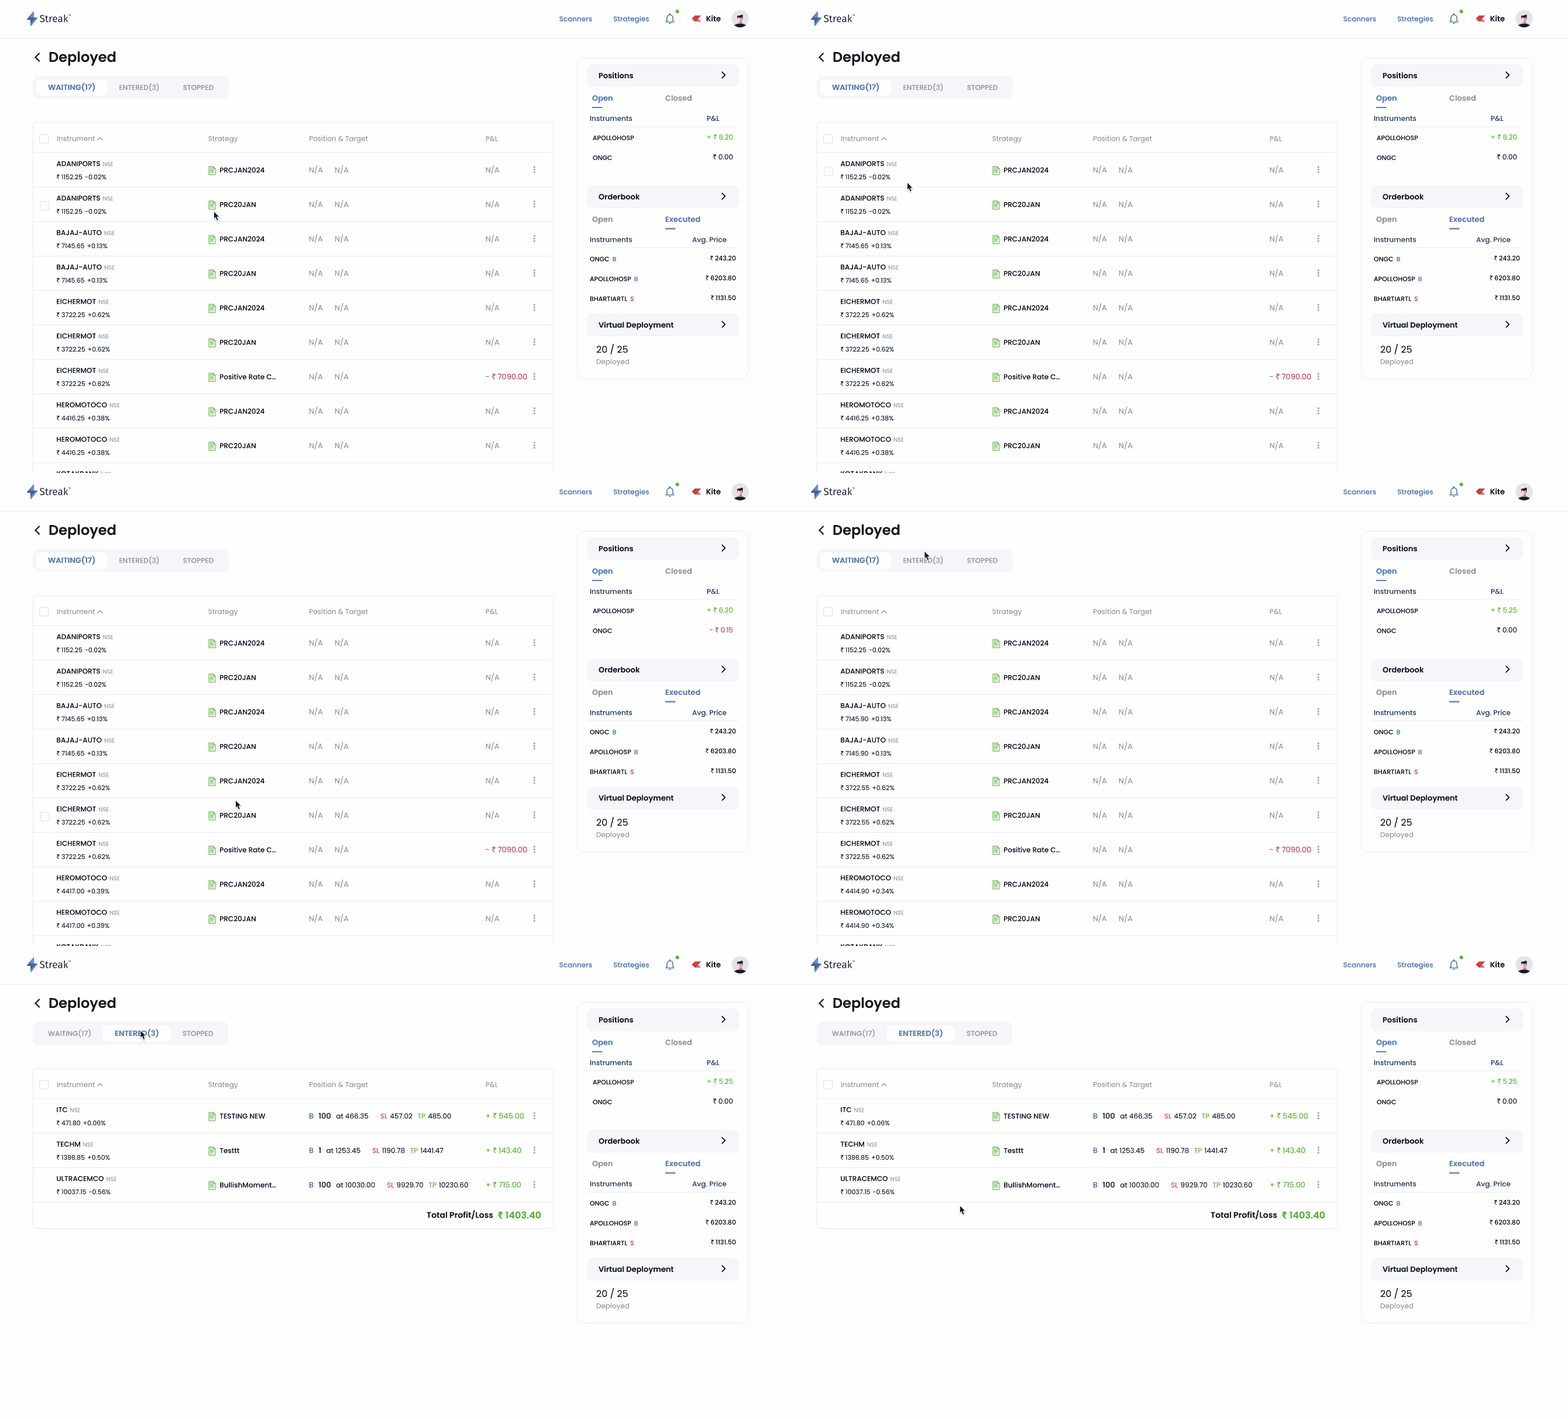
The deployed strategies section shows the 3 different states of a strategy:
- Waiting
- Entered
- Stopped
Waiting
Indicates that the strategy is waiting for the entry position based on the conditions in your strategy.
The moment the ENTRY criteria is met the strategy moves from Waiting to the Enetered tab.
Entered
Strategy in the entered state means that the system has assumed a virtual entry position and is now waiting for the exit condition to trigger. Please note that no real orders are placed and your capital is not used under any circumstance.
Stopped
If the strategy cycle is 1 then after the exit condition is met the strategy moves to the Stopped state. Do note, if your strategy cycle is 2 or more than 2, the strategy will move to the waiting state to wait for the entry singal again. The strategy can also move to stopped state if the Strategy was manually stopped by you.
Orderlog
You can view the complete details of strategy stages from the orderlog in the deployed page. Here you will be able to see order details including entry/exit time in orderlog.
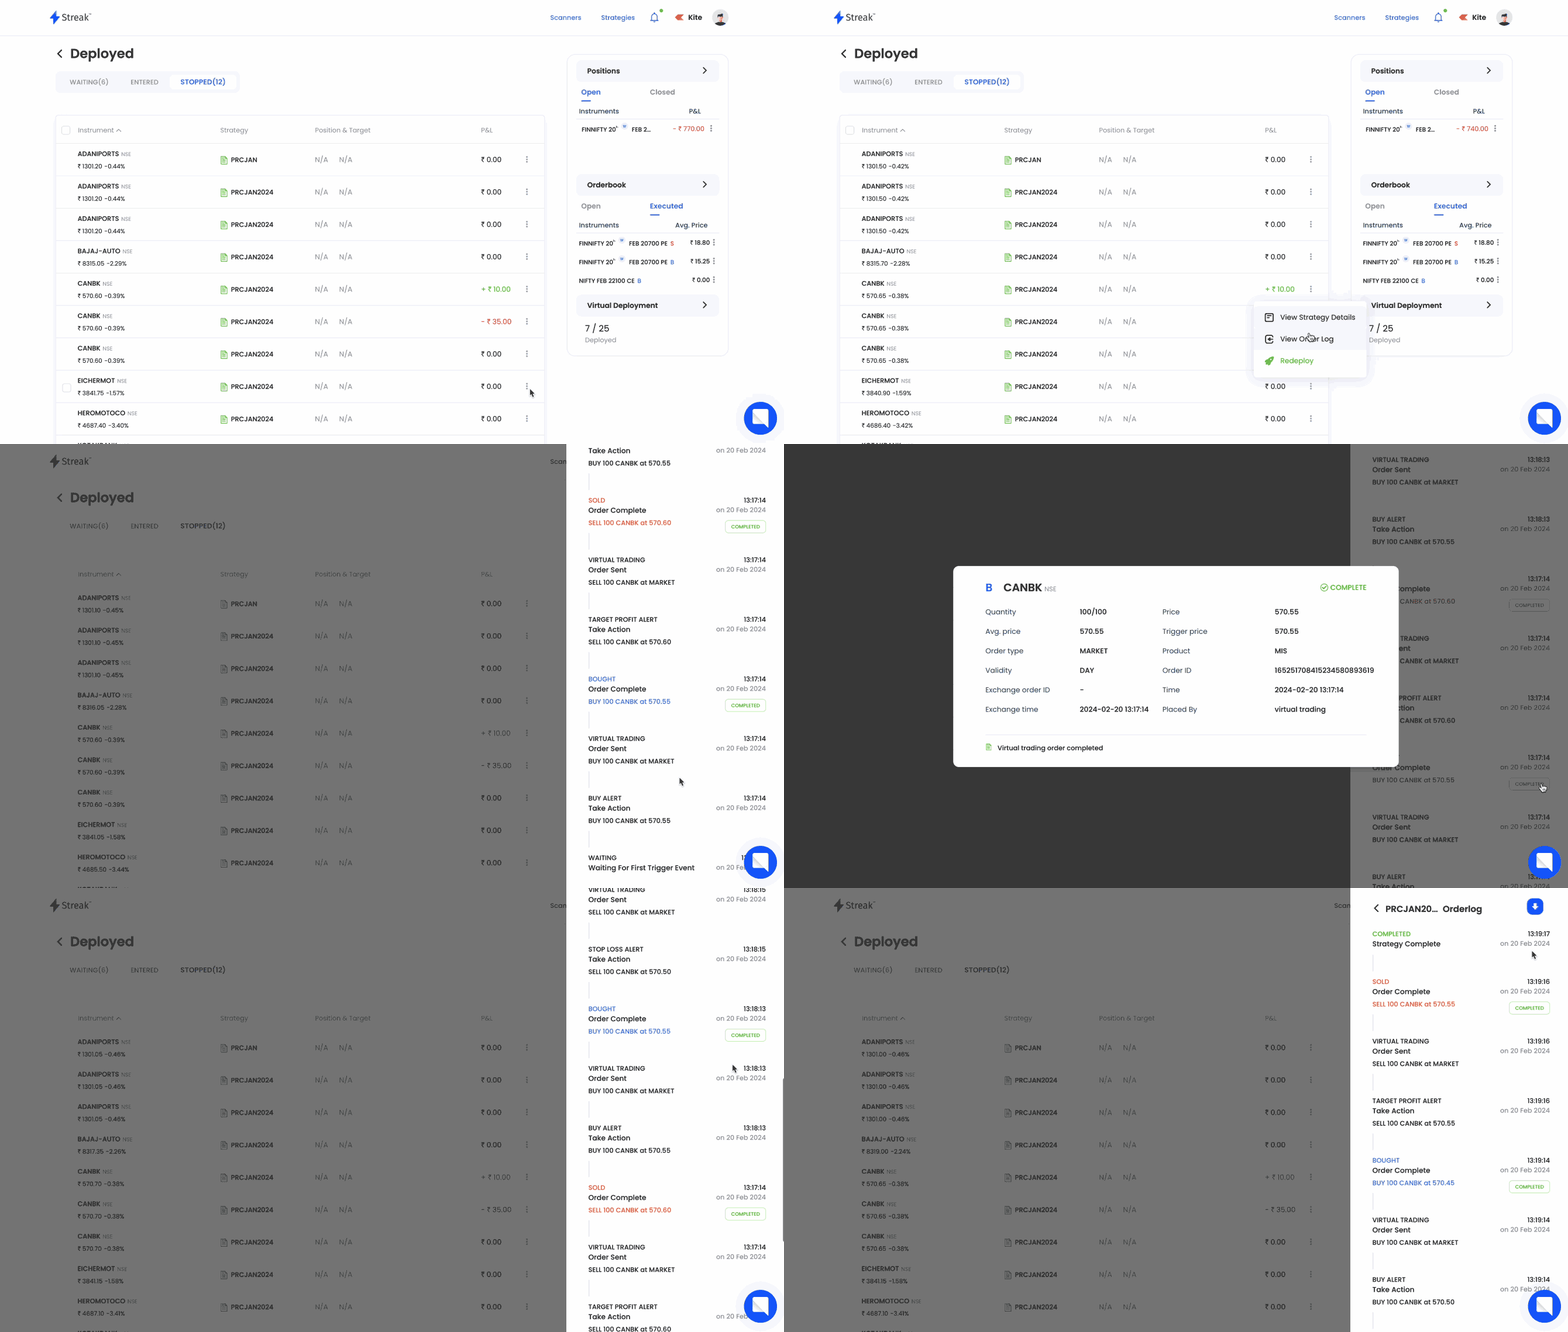
Orderlog details for a trading session is only availble till midnight. You can download the CSV file before midnight to save the details.
Stop strategy
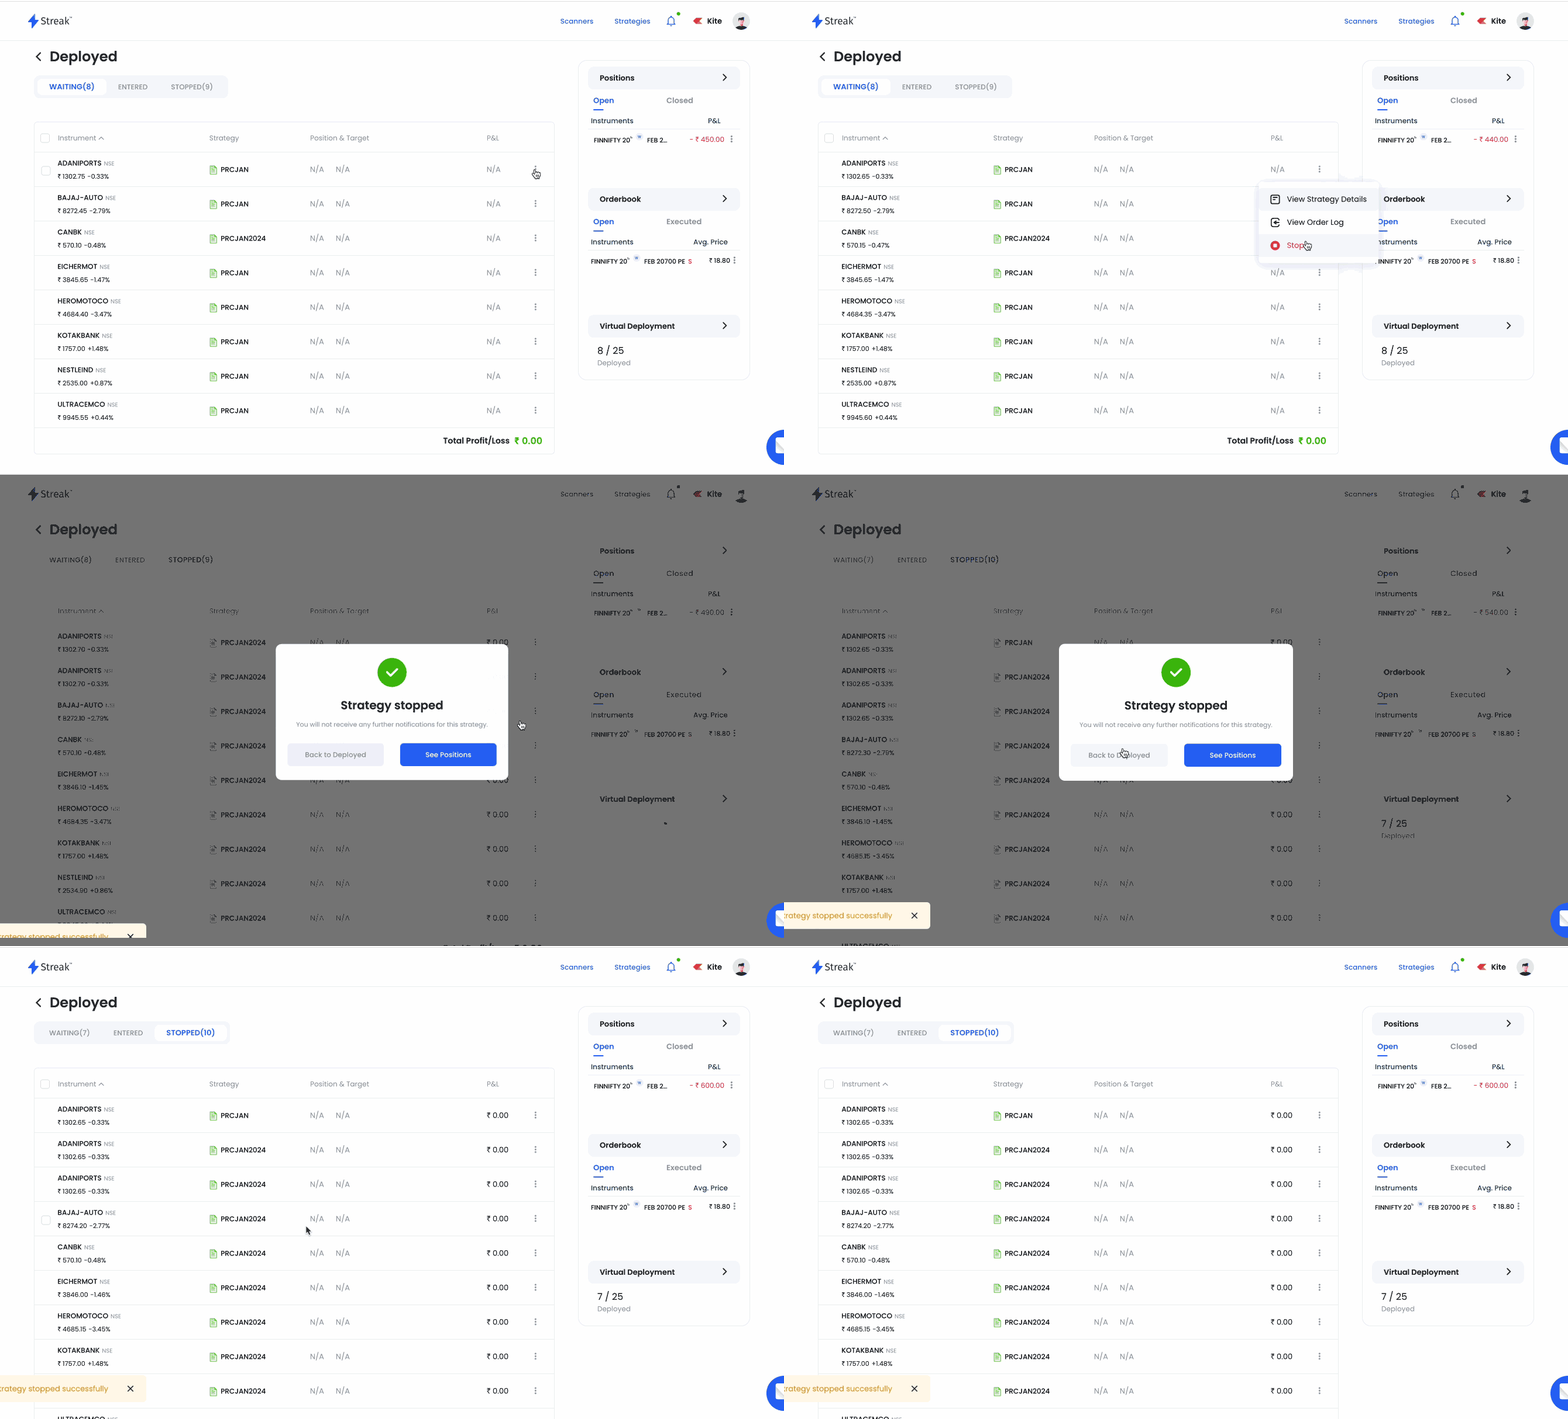
The strategy can be stopped any time by clicking on the three dots and then choosing "Stop" button.
Redeploy strategy
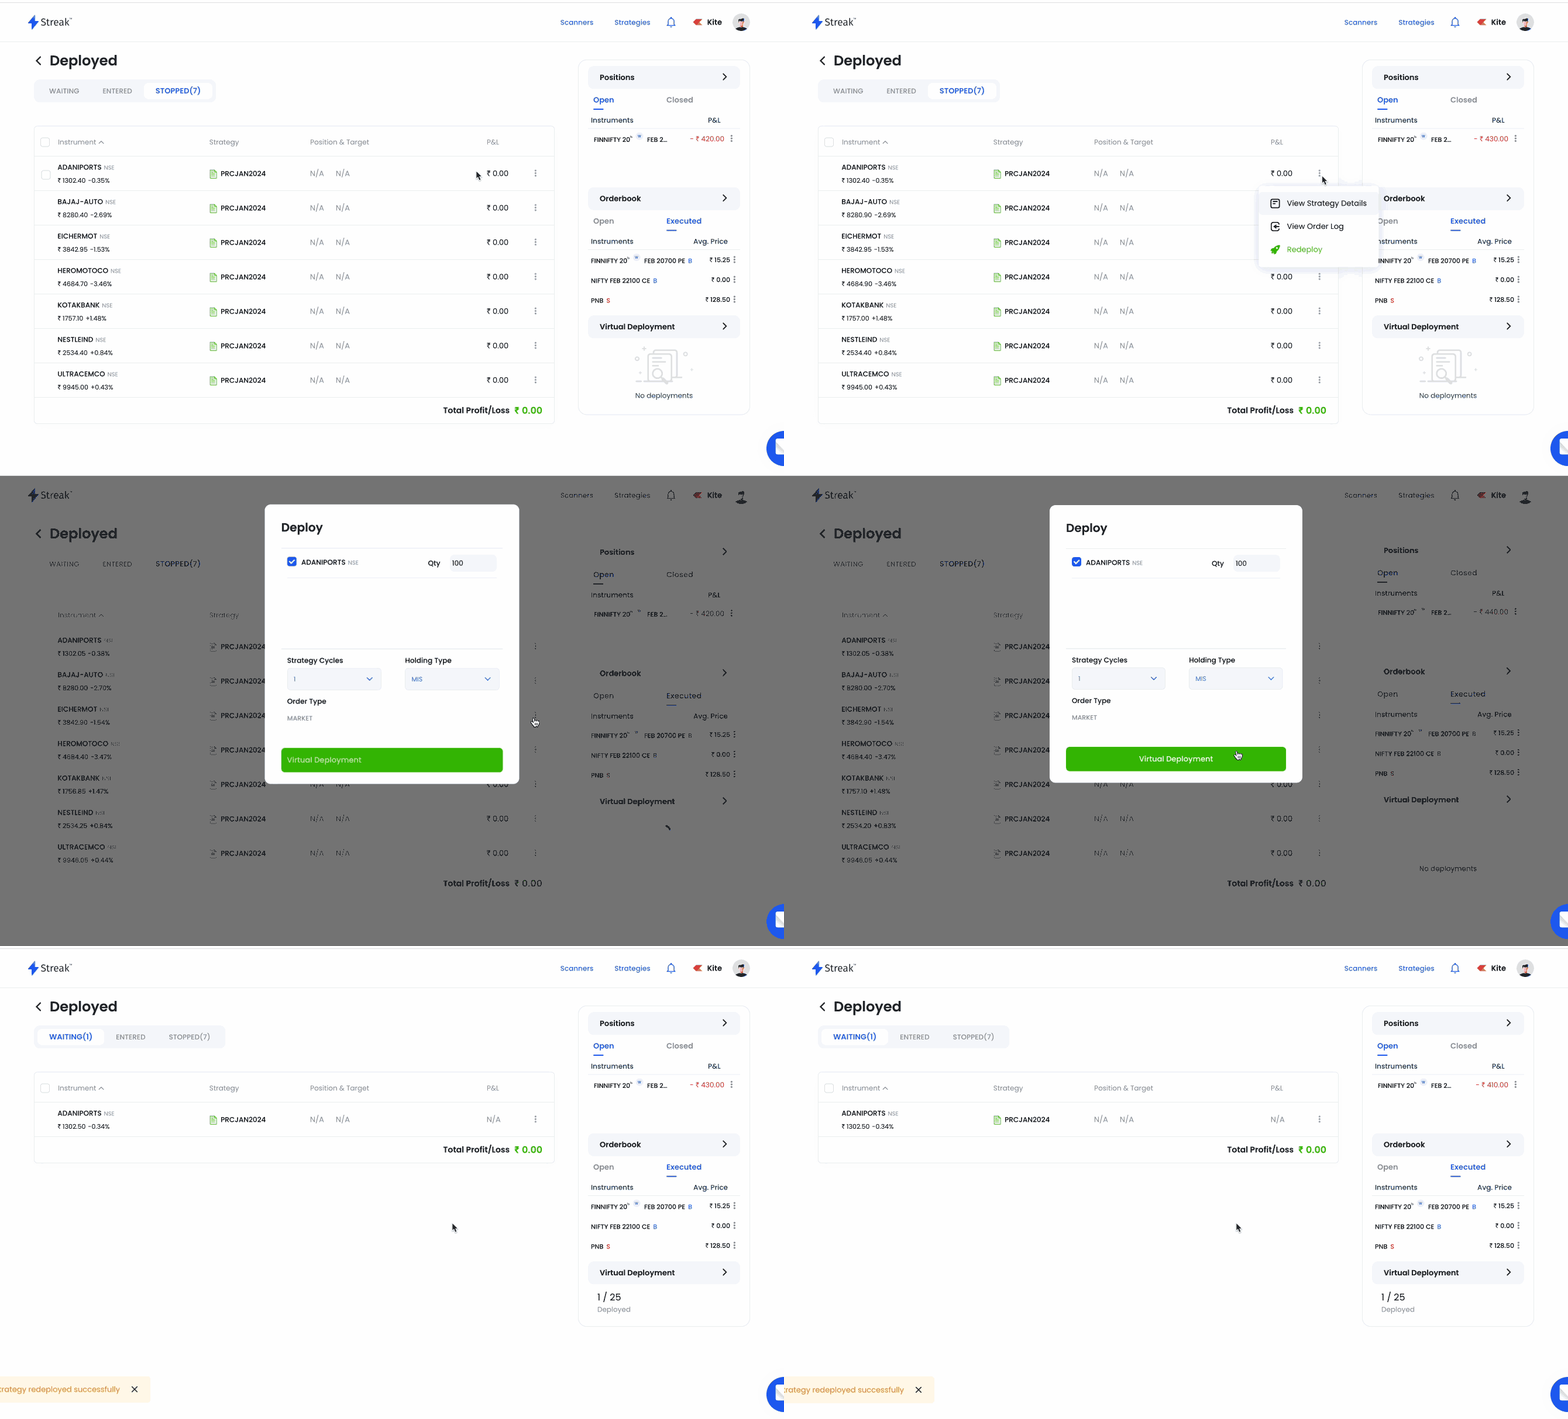
You can always Redeploy a stopped strategy anytime and it will move to "Waiting" state in the deployed section.
-
Disclaimer: The results of all the backtest are hypothetical and does not guarantee or portray in any form or manner any future performance or returns. Historical data is subject to limitations like rounding off, memory buffer limits, user's browser, system limitation, data availability, accurate data etc ↩