Create basic
Creating a strategy
Using Streak’s intuitive interface and elegant design, creating a strategy is as simple as typing out technical indicators, keying in stop loss and target profit percentage and selecting the stocks you want to trade with.
Streak platform supports more than 80 technical indicators including Supertrend, MACD, RSI, Momentum indicator, Moving Average etc.
All-new Multipage Mode
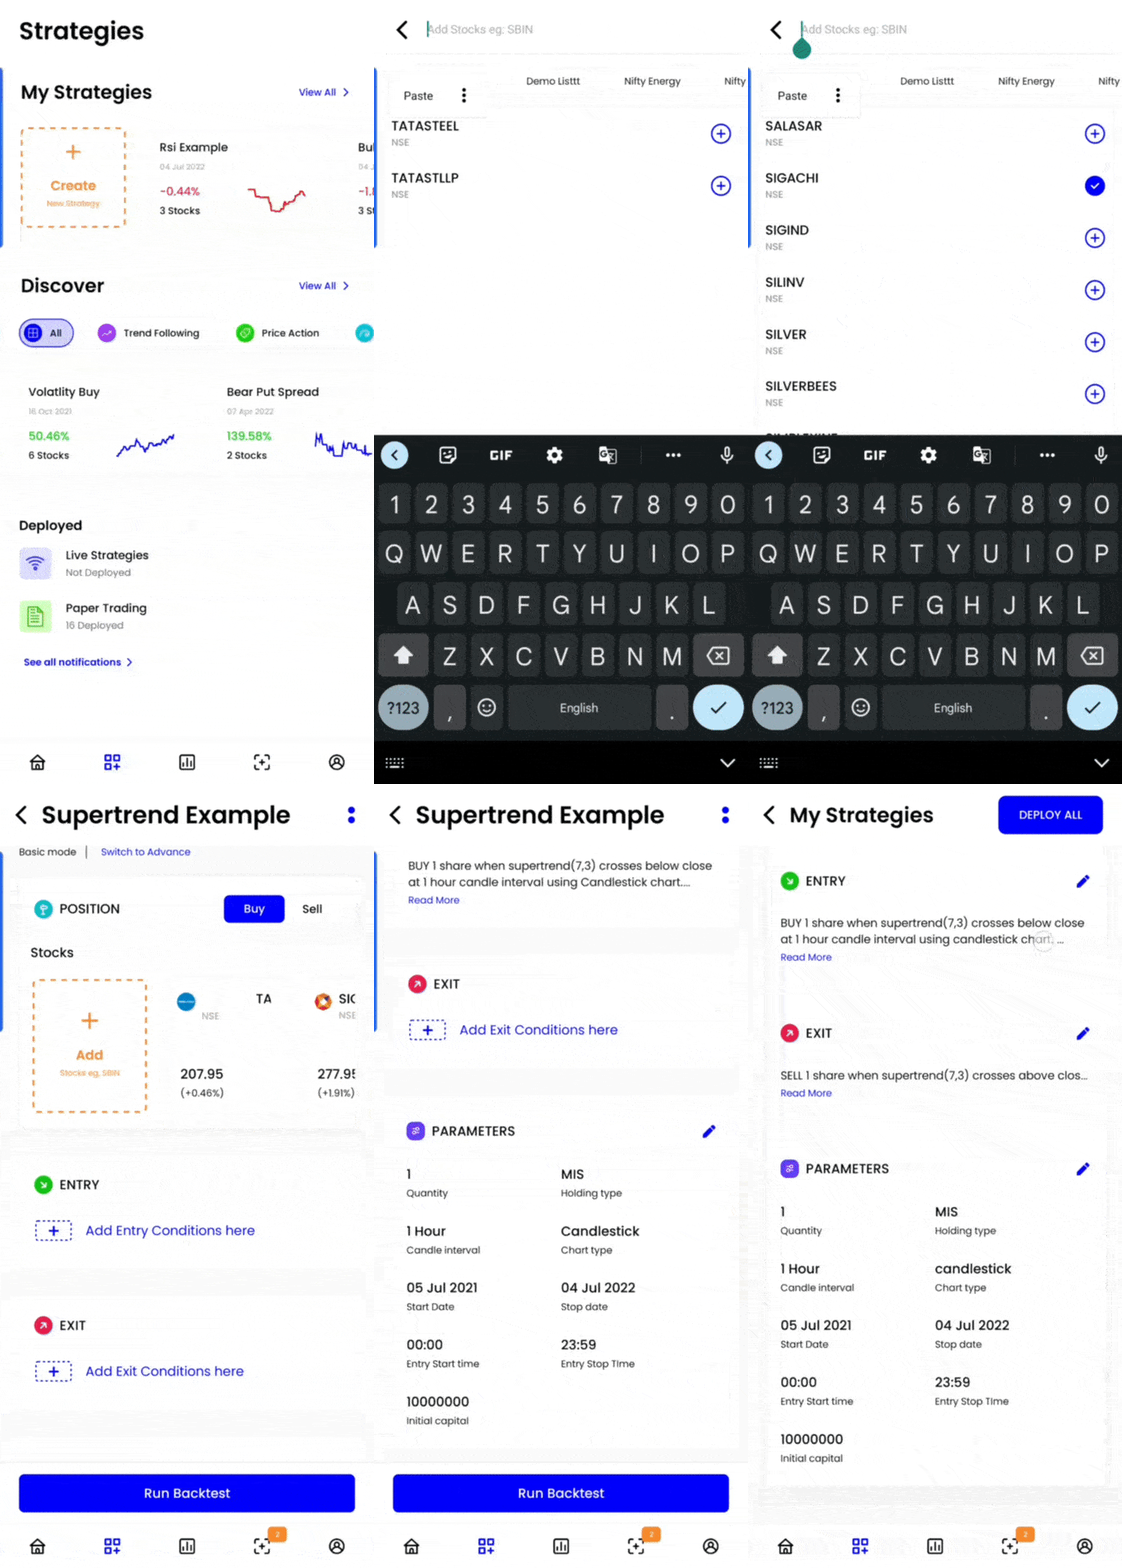
In this the create page is divided into 4 pages as explained below
- Positions - Here you have to add instruments, select the Chart Type, Candle Interval, Holding Type and Quantity.
- Entry - Choose the position type (Buy/Sell) and create your uniquie entry conditions by using more than 80 indicators from our repository. Also mention the Entry start and stop time, if any.
- Exit - Input the Stoploss and Target profit value. You can also add any indicator based exit conditions (this is optional)
- Review - Before you save and backtest your strategy, this page allows you to give a final review to all the parameters and conditions created uptill now. Additionally you can fine tune backtest parameters like initial captial and backtest start/stop date. Also feel free to add a personalised description to your strategy so that you never forget the idea behind the strategy.

Parameters required
-
Scrip/Instrument Select the stock, commodity, or currency futures from NSE. You can add upto a maximum of 50 instruments in a single strategy. You can also select custom built Technical List to add multiple instruements in your strategy in a single click.
-
Candle Interval
- 1 minute checks for signals on minute candles with a maximum allowed window of 30 days
- 3 minute to 30 minutes checks for signals on the respective candles based on data availability with a maximum allowed window of 90 days.
- 1 hour candle checks for signals on an hourly candle with a maximum allowed window of 1 year based on data availability.
- 1 day candle checks for signals on a day candle with a maximum allowed window of 5 years based on data availability.
-
Position allows users to define the entry type (i.e. buy/sell).
-
Quantity states the number of equity share or future lots to be used by the strategy.
Example
Scrip: SBIN, SBIN22MAYFUT Timeframe: 15 min
Position: Buy Quantity: 1
In the above example, the platform will consider the quantity for SBIN as 1 and quantity for SBIN22MAYFUT as 1 lot, i.e. 1500 stocks.
-
Indicator Each condition in a trading strategy has 3 parts:
- Indicator1 - Technical indicator such as RSI, MOM, Supertrend etc.
- Comparator - A logical comparator such as higher than, lower than etc.
- Indicator2 - Something to compare Indicator1 with, a value such as number, OHLCV etc.
-
Stop loss & Target profit percentage: For any rules based trading system it is mandatory to enter stop loss and target profit percentage as a part of creating a strategy. It is very important that traders plan their entry/exit and risk before entering a trade so as to better manage their risk.
-
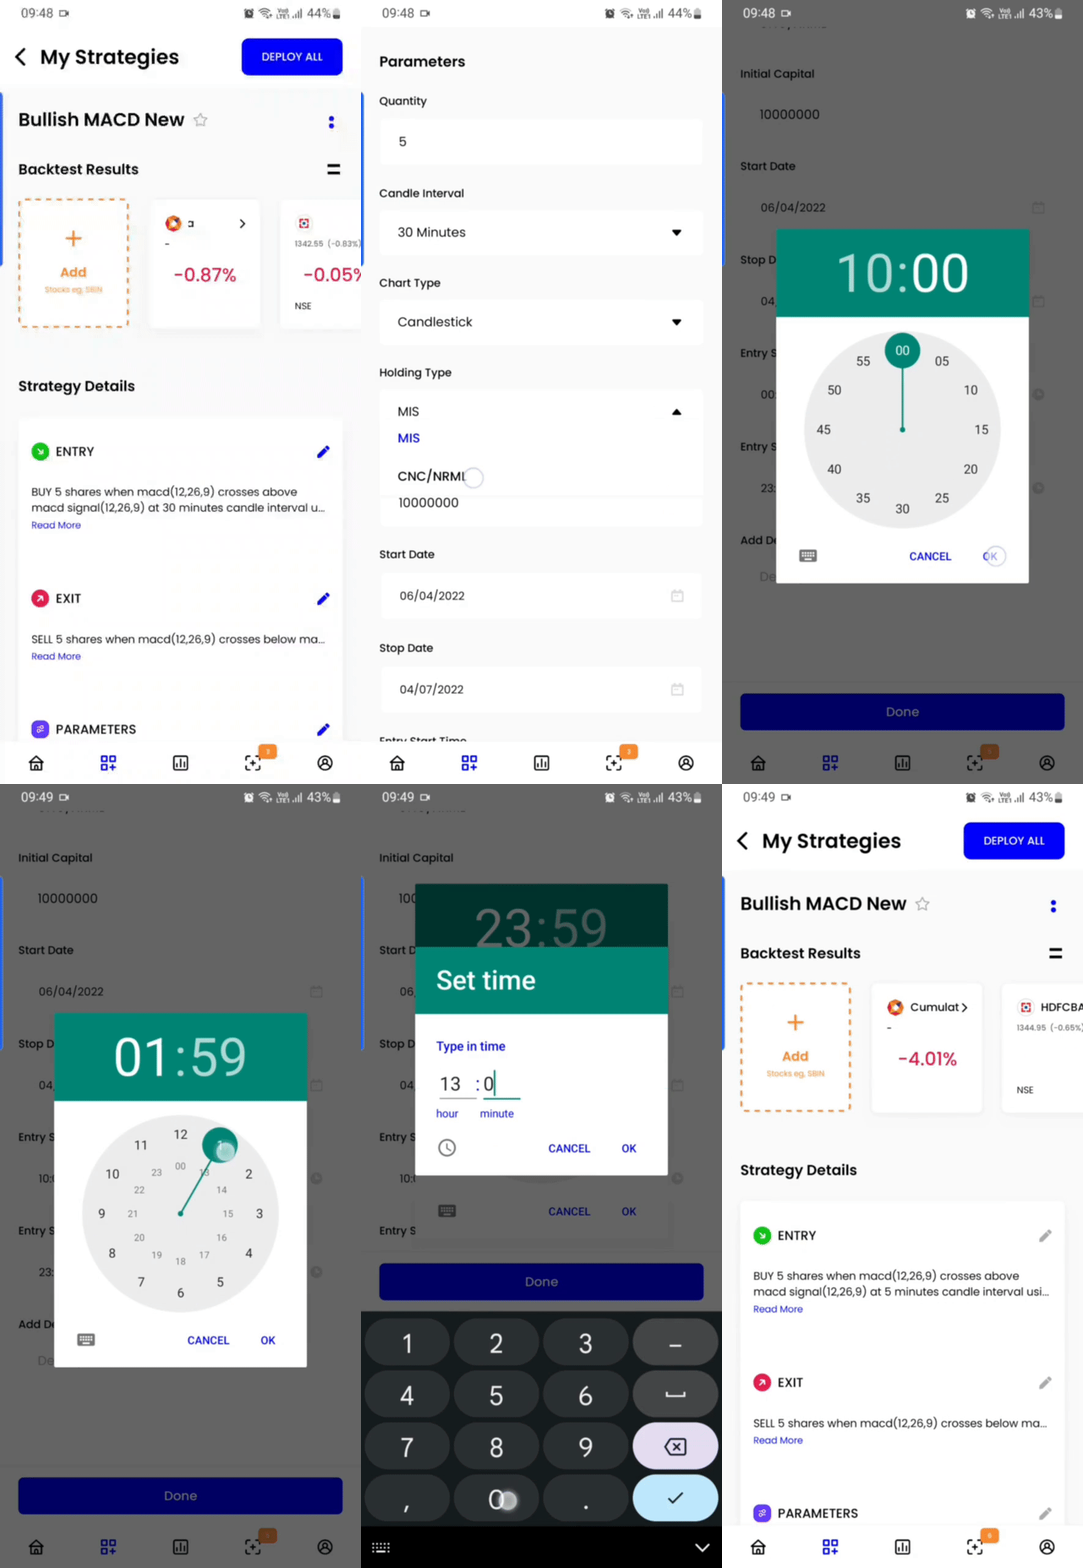
Backtest Parameters There are 4 more options available to users:
- Chart type: You can change the chart type here. You can use Heikin-Ashi, Candlestick or Renko charting.
- Holding type: You can change order type from MIS(Intraday) to CNC/NRML(Delivery). This will change the backtest results as well.
- Entry start and stop time can also be customized as per requirements, by default it is set from 9:00 AM to 11:59 PM
- Initial captial: This is the hypothetical captial required to enter a trade in the backtest period. By default the value is set to 1 crore (10000000) and it does not represent any capital held by the user and is for backtest purposes only. While backtesting an entry will only be triggered when the notional value of the trade is less than the
Initial capital + Cumulative Profit or Loss uptill previous trade.
Points to remember when using Entry Start and Entry Stop time
-
Given trade time is only inclusive of candle close time.
Example:
If trade entry time is given between
11:10 AM to 03:00 PMand for a 15 minute candle interval. Then for 11:00 AM candle since it closes at 11:15 AM and meets the entry condition, the trade will be executed. Similarly, for 03:00 PM candle, the close time is 03:15 PM, even if it meets the entry condition but since the trade time given was only till 03:00 PM trading signal will not be generated. -
While backtesting the close time for a candle is consisdered as 'Close time - 1 milisecond'
Example:
Candle Interval: 5 minsEntry start time: 9:20Entry stop time: 2:15Now if the entry condition is true on the first candle close (a 5min candle of 9:15, will close at 9:20), the entry will not be captured in the backtest as candle close time in backtest is assumed as "9:19:59:999".
However, for the same parameters a deployed strategy will receive the alert because the trigger will be generated at 9:20:xy seconds. Since the alert time is higher than entry start time, a triggered is generated.
By keeping the entry start time as 9:19 one shall receive alert in both, backtest and in deployment.
-
As a thumb rule, to get same results for backtest and deployments you can keep the start/stop time as below
Entry Start time:earliest signal time you want to receive the alert (minus) - 1 minuteEntry Stop time:last signal time you want to receive the alert (plus) + candle interval (plus) + 1 minute

- Strategy name: You need to set a unique name to the strategy and click on Save and Backtest .
Info
Backtest is run keeping intraday orders (MIS) as default. You can change it to CNC/NRML from the backtest parameter section.
Examples
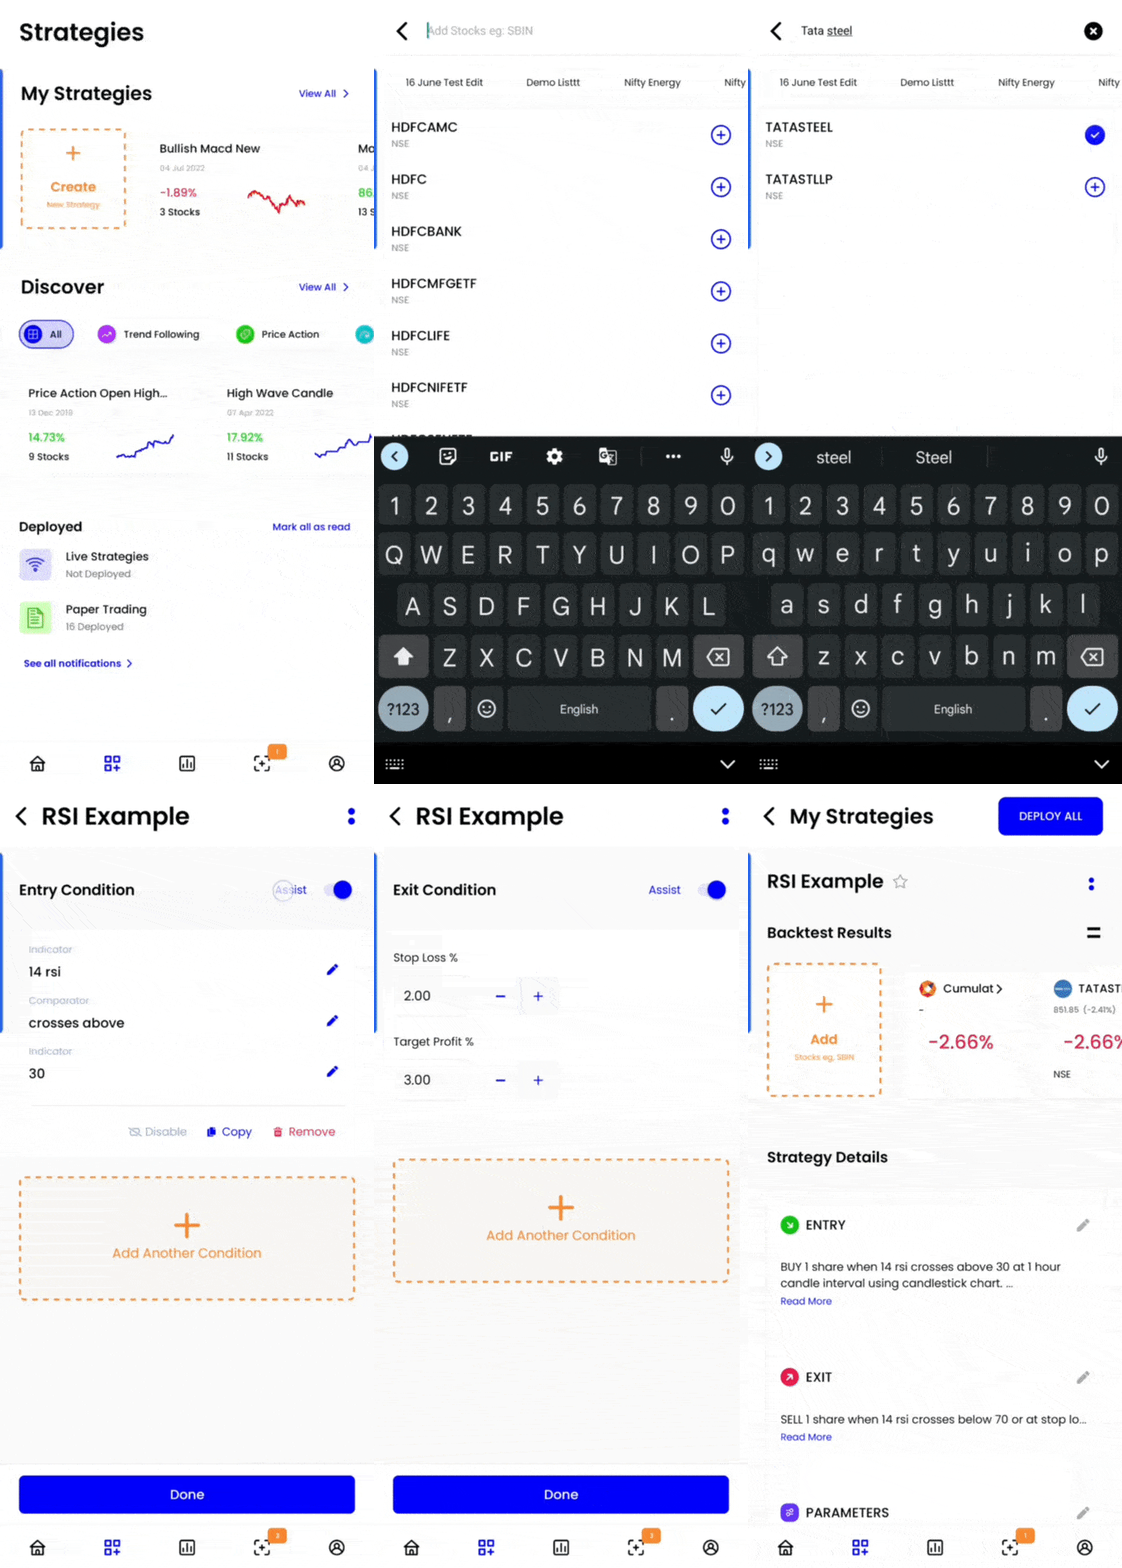
RSI indicator
- Give this strategy a unique name
- Add scrips of your choice like, INFY
- Select candle interval as 30 minutes
- Set a position as Sell
- Enter quantity as 100
- In the Technical indicator field type RSI and you get a drop down that consists of RSI and select it (leave the default value)
- After selecting the Technical indicator, we know that if RSI is above 70, then it is in overbought territory. And you would want to sell the stock when RSI crosses below 70, so select crosses below in the comparator field
- Now in second indicator field search and select Number and enter 70
- If 'Assist' is on, the above steps will be taken care of by the assist feature.
- For Exit condition (Optional): RSI Crosses above 30 you can keep as the exit condition
- Enter Stop loss as 1% and Target profit as 2%
- Click on Save and Backtest
Note
Streak has made it simple for you, usually the process of coding a similar strategy on traditional platforms would have taken about 2 hours depending on your coding skills and data availability.

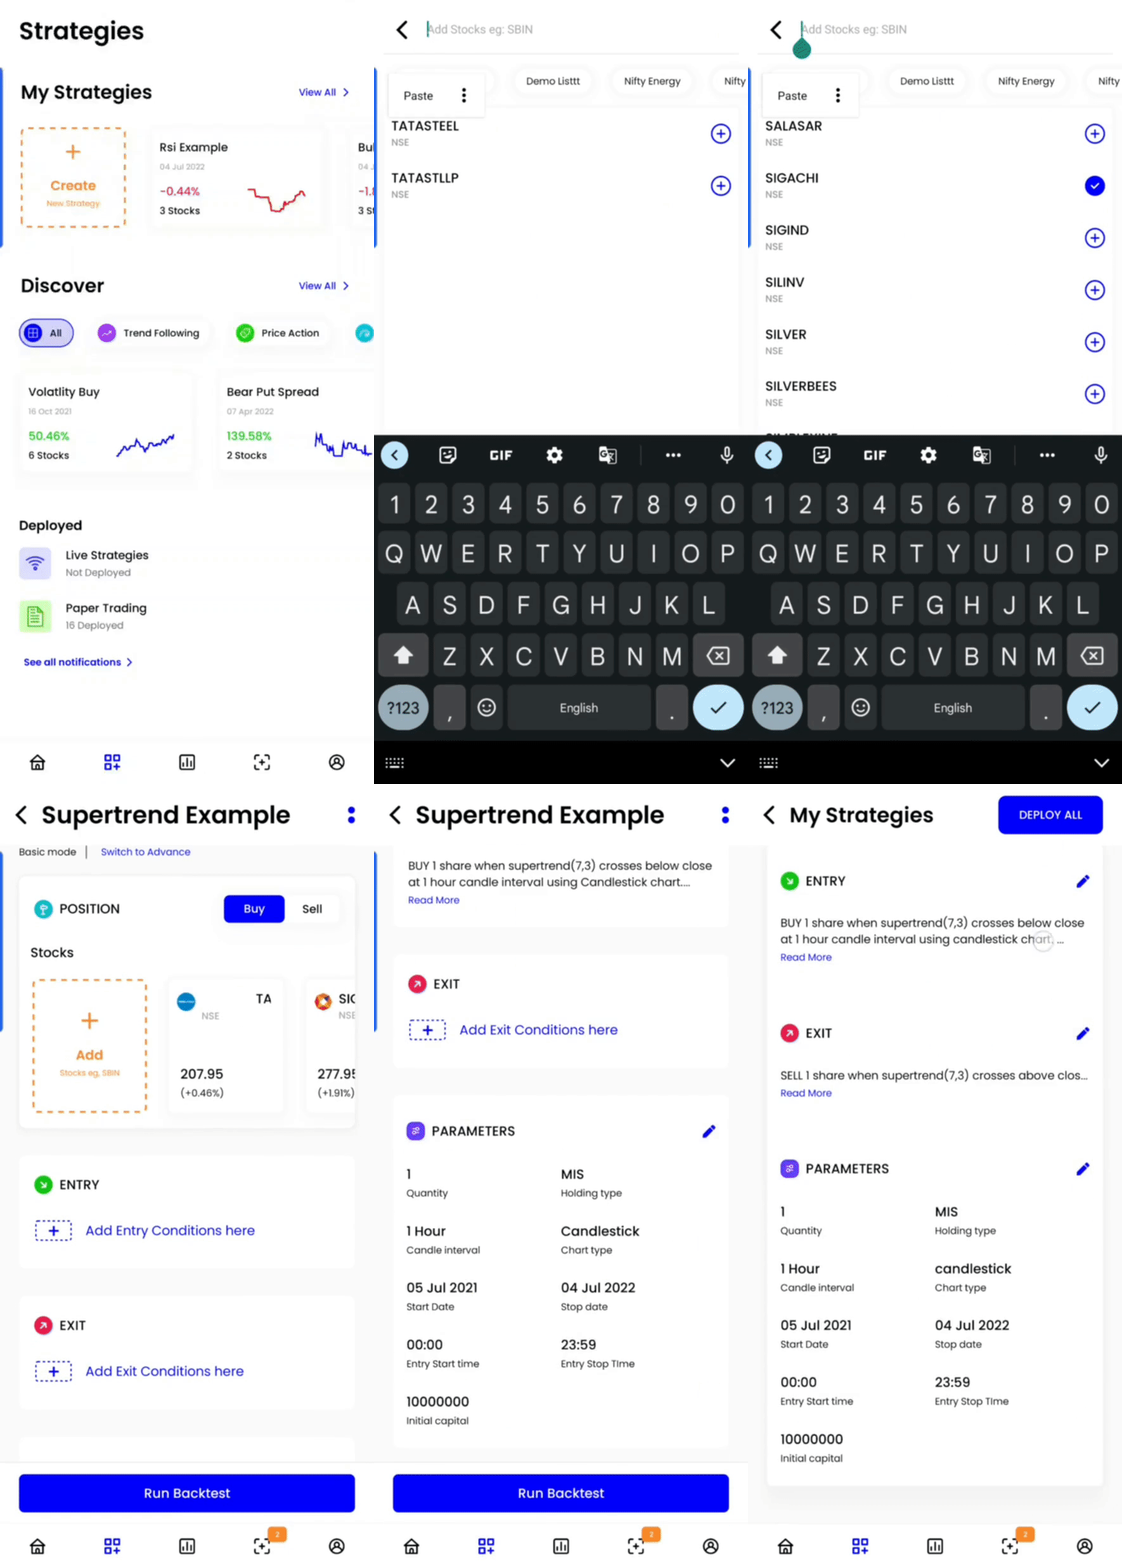
Supertrend
- Add sample basket Supertrend - Sample Basket
- Choose time frame as 10 mins
- Select your position Buy
- Enter quantity as 1
- In technical indicator field search of supertrend and select the Supertrend indicator from dropdown and click ok with default values as it is.
- Choose crosses below in comparator field
- Now in second indicator field Select Close
- Add the Stop Loss and Target Profit % of 0.5 and 1 respectively.
- Give this strategy a unique name and run Backtest

Points to remember
- The Backtest parameters section allows you to select different charts types.
- You can add upto a maximum of 10 entry and exit conditions (for Ultimate plan).
- You can select different time settings to enter a stock in the backtest parameters section.
- The limit of every basket/technical list is 100 and you can create strategy for upto 50 stocks in one go.
- The backtest limit per day for Regular plan is 300 and you get 30 live deployments at any given time. For the Ultimate plan, you can backtest upto 1000 times and deploy 100 strategies at a point of time
More on Create
Entry condition
Entry condition forms a logical point to generate an entry signal to take a position. An entry condition can be comprised of one or more individual conditions which must be logically "true" to generate a signal. An individual condition is created by comparing one value/parameter/indicator with another value/parameter/indicator.
Example
20 SMA higher than 10 SMAHere, the condition will be logically true when the value of '20 SMA' is more than the value of '10 SMA'.
The generation of a trading signal is determined by the logical combination of the conditions being true for the current candle and it being false in previous candle.
Combining conditions (with "AND"/"OR")
When a trading strategy has multiple conditions, these conditions are combined together using "AND"/"OR" to collectively form a single strategy with a single entry/exit point event. The output of the combination of entry/exit conditions is based on digital logic operations.
Strategy logic is calculated in the order specified by the user with "AND" having higher preference over "OR".
Note
- logic1 AND logic2 OR logic3 AND logic4 will be calculated as (logic1 AND logic2) OR (logic3 AND logic4)
- logic1 OR logic2 AND logic3 will be calculated as logic1 OR (logic2 AND logic3)
Exit condition
Exit condition defines the point at which a position can be exited. Adding an exit condition is optional. After the strategy enters a position, the stop loss price and the target profit is calculated on the average of the entry price.
1. During a backtest, if the close price crosses either of the exit price points (SL,TP) in the current candle, an exit is triggered. However, if the exit signal is met, the hypothetical exit order is placed on the open price of the next candle.
2. After deployment, for live strategies, if the strategy has entered a position in the market and the LTP (last traded price) crosses either of the exit prices point(TP SL) or the exit signal is met, an actionable alert is sent to the user on which they can click "buy/sell" to place a market order in the exchange.